![]() Until Zabbix3, trend data was not available via the Zabbix API. This meant that you could retrieve the raw values of a key over time, but not the aggregated historical trends of that value (e.g. CPU average over 5 minute intervals).
Until Zabbix3, trend data was not available via the Zabbix API. This meant that you could retrieve the raw values of a key over time, but not the aggregated historical trends of that value (e.g. CPU average over 5 minute intervals).
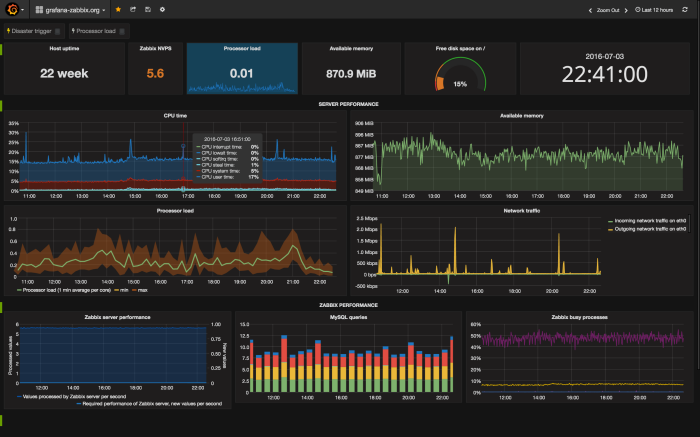
The only way to monitor trends was to look at the visual graph generated by Zabbix or query the underlying database directly. Meanwhile, graphs are arguably one of Zabbix’s weak points, especially given newer solutions like Grafana.
This was a major oversight in Zabbix2 functionality, and led to community patches that enabled this functionality in Zabbix 2.x. With this trend data now exposed, the community was free to write custom alerting, graphing, and capacity planning tools. For example, the Zabbix plugin for Grafana relies on this patch when the data source is Zabbix 2.x.
Patch Deployment
Applying this patch for a 2.4.x Zabbix server can be done by first downloading the patch from ZBXNEXT-1193, CTrend_for_Zabbix_2_4_4.zip. The instructions below are for Ubuntu 14.04.
> cd /tmp
> wget https://support.zabbix.com/secure/attachment/34256/CTrend_for_Zabbix_2_4_4.zip
> unzip CTrend_for_Zabbix_2_4_4.zip
This creates a folder ‘/tmp/frontend/include’ that contains the patched files. The first step is to backup our current zabbix files in case we need to rollback:
> cd /usr/share/zabbix/include
> tar cvfz classes.tar.gz classes/
Now copy the patched files over the top of the zabbix directory:
> cp -r -v /tmp/frontend/include/ /usr/share/zabbix
Then restart the Apache server:
> service apache2 restart
Validate
To check whether this functionality is working, I find it easiest to use a browser extension that specializes in debugging REST calls. The one I use for Chrome is from restconsole.com, but anything (including curl) will work if that is what you are comfortable with.
The API entry point for Zabbix is static, and always http://<server>/zabbix/api_jsonrpc.php. There is no variance in the URL for different calls, and instead the API sends a ‘method’ value in the body that signifies what operation we want to perform. Set the sending ‘Content-Type’ to ‘application/json-rpc’ for all calls as well.
First, POST a check to the API version using the body content below:
{"jsonrpc":"2.0","method":"apiinfo.version","id":1,"auth":null,"params":{}}
which should return something like:
{
    "jsonrpc": "2.0",
    "result": "2.4.8",
    "id": 1
}
This verifies that we can reach the API successfully. Then get a login to the API to perform other operations by POSTing a valid set of credentials:
{ "jsonrpc": "2.0", "method": "user.login", "params": { "user": "Admin", "password": "zabbix" }, "id": 1, "auth": null }
This should return something like below where the result is a session key that must be used in our subsequent calls
{
    "jsonrpc": "2.0",
    "result": "19b7c632323ebeed2c15dca7ff023c5b",
    "id": 1
}
Now, within the Zabbix Web GUI, go to Monitoring > Latest Data, and pick a host and then value of interest. The ‘Available Memory’ key is an easy one to choose, and usually has good variance. What we want to do is get the unique identifier number for this item.
One way is to click on ‘graph’ and you should see a graph of the available memory over time, and if you look at the URL, you will see in the URL parameters ‘itemids[]=xxxx’. This is the itemid number, and let’s use it to pull the latest raw values reported to Zabbix.
Your itemid will differ from mine (itemid=23296), but now let’s POST this request for the raw values of available memory for this host. The ‘history’ parameter set to 3 denotes it is a ‘numeric unsigned’ value (0=float,1=char,2=log,3=num unsigned,4=text). This is important to get right, because otherwise a different table will be queried and you will get back an empty result.
{
    "jsonrpc": "2.0",
    "method": "history.get",
    "params": {
        "output": "extend",
        "history": 3,
        "itemids": "23316",
        "sortfield": "clock",
        "sortorder": "DESC",
        "limit": 10
    },
    "auth": "19b7c632323ebeed2c15dca7ff023c5b",
    "id": 1
}
The result will look something like:
{
    "jsonrpc": "2.0",
    "result": [{
        "itemid": "23316",
        "clock": "1483887556",
        "value": "558051328",
        "ns": "984493383"
    }, {
        "itemid": "23316",
        "clock": "1483887496",
        "value": "558010368",
        "ns": "960056046"
    },
....
  ],
  "id":1
}
But that is just for the history values, which as we talked about earlier are the raw values being reported back to the system. These raw values cannot be kept in perpetuity or the row count would be unmanageable, and so the system aggregates these values as the days/weeks/months pass.
This aggregated data is the trend data, and now that we have patched the system, we can retrieve it using the API. Notice the change in the ‘method’ to ‘trend.get’ and instead of the value type of 3 (unsigned int) being set in a parameter named ‘history’, now we do it with a parameter named ‘trend’. If you POST this:
{
    "jsonrpc": "2.0",
    "method": "trend.get",
    "params": {
        "output": "extend",
        "trend": 3,
        "itemids": "23316",
        "sortfield": "clock",
        "sortorder": "DESC",
        "limit": 10
    },
    "auth": "19b7c632323ebeed2c15dca7ff023c5b",
    "id": 1
}
Then you get aggregated minimum, average, and maximum values over the time period and you can analyze trends and capacity using either custom tools or even graphing them using the Zabbix plugin for Grafana.
{
    "jsonrpc": "2.0",
    "result": [{
        "itemid": "23316",
        "clock": "1483884000",
        "num": "60",
        "value_min": "557817856",
        "value_avg": "568083182",
        "value_max": "609497088"
    }, {
        "itemid": "23316",
        "clock": "1483880400",
        "num": "60",
        "value_min": "549257216",
        "value_avg": "563616972",
        "value_max": "626892800"
    },
...
    "id": 1
}
REFERENCES
https://support.zabbix.com/browse/ZBXNEXT-1193
https://github.com/alexanderzobnin/grafana-zabbix
https://www.zabbix.com/documentation/2.4/manual/api