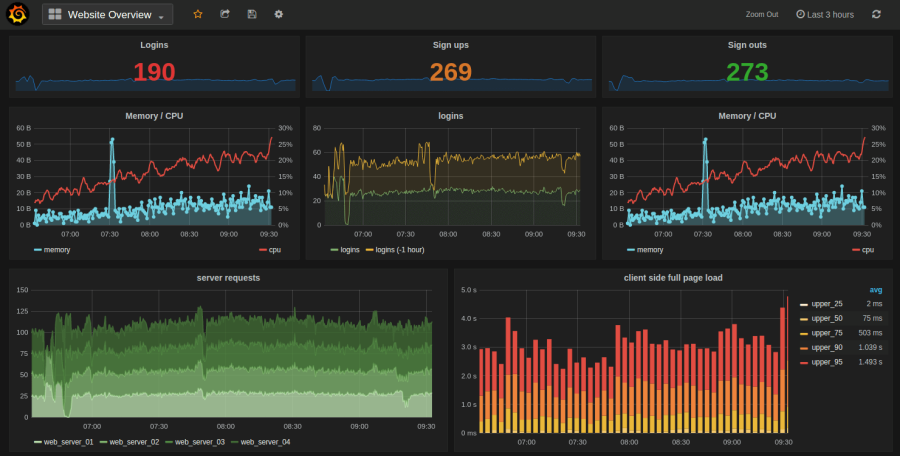
![]() Grafana is an open-source visualization suite that is able to generate graphs and dashboards, in addition to alerting.
Grafana is an open-source visualization suite that is able to generate graphs and dashboards, in addition to alerting.
It is designed to retrieve data from various backends including: Graphite, ElasticSearch, Prometheus, and Zabbix.
This article will lead you through an installation of the latest stable version on Ubuntu 14.04.
Installation
The instructions below are based on the official installation documentation. First, we will add the custom package repository to our apt sources and install the packagecloud key.
# echo "deb https://packagecloud.io/grafana/stable/debian/ jessie main" >> /etc/apt/sources.list

# curl https://packagecloud.io/gpg.key | sudo apt-key add -
Next we want to install the grafana package and create the service scripts for automatic startup.
# apt-get update
# apt-get install grafana# update-rc.d grafana-server defaults 95 10
# ufw allow 3000/tcp
# service grafana-server start
Now that the server is started, you should be able to get to the grafana login page using your browser pointed at http://<server>:3000/
The default credentials are admin/admin. That as well as other configuration values can be found in /etc/grafana/grafana.ini
REFERENCES
http://docs.grafana.org/installation/debian/
https://voip4learn.blogspot.com/2015/06/which-ubuntu-version-is-equal-to-which.html