![]() The Logstash Indexing layer receives data from any number of input sources, transforms the data, and then submits it to Elasticsearch for indexing. Transforming and extracting data from every event can be both I/O as well as CPU intensive.
The Logstash Indexing layer receives data from any number of input sources, transforms the data, and then submits it to Elasticsearch for indexing. Transforming and extracting data from every event can be both I/O as well as CPU intensive.
Horizontal or Vertical
Vertical scaling will only go so far in the Logstash indexing layer. In order to keep up with the processing demand as well as provide availability, horizontal scalability must be employed.
And if you are going to have vertical scaling, you should be using either configuration management (SaltStack, Ansible, etc.) or containers to be able to create extra Logstash indexing instances without excessive manual steps.
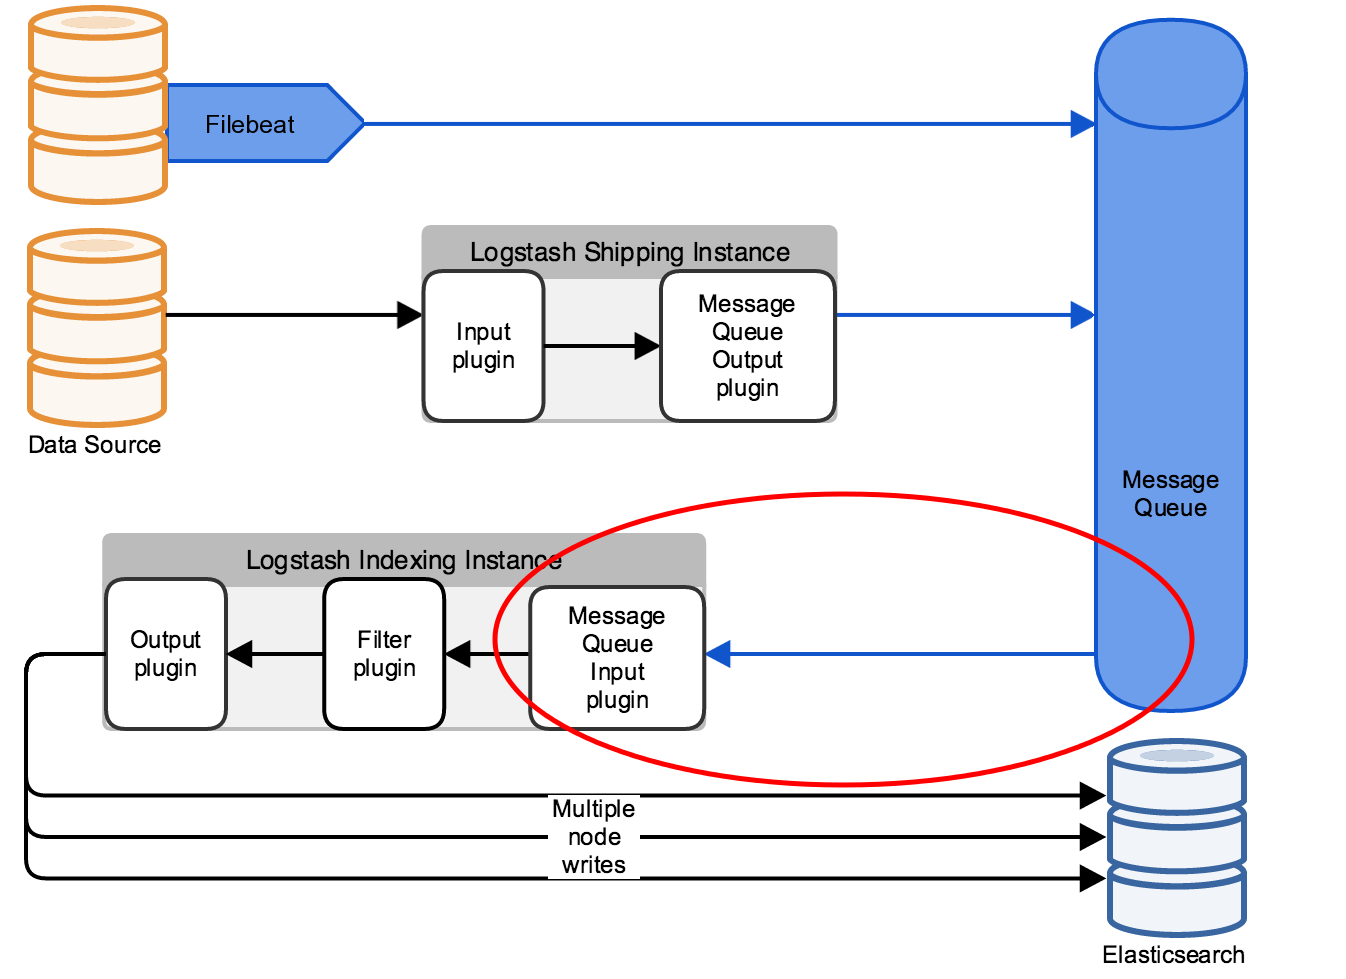
Prefer pull
As described in my article on the log input tier, inserting a message queue can smooth out throughput spikes that would otherwise stall the pipeline.
But it also creates a linearly scalable architecture where 1-to-n Logstash indexing hosts can consume events from the queue/topic. Instead of pushing events to Logstash, each Logstash instance is able to pull events at the highest rate possible.
…But accept push
It is likely that there will still be event sources that push directly to the Logstash indexing layer, and for those events, a load balancer like Nginx or HAproxy is elegant because it transparently provides a single DNS name while providing access to all the Logstash instances.
Tune worker count
A general rule of thumb is to use the same number of workers as you have CPU cores. This can be set with the ‘-w’ flag, or in 5.x versions of Logstash in the logstash.yml file with’pipeline.workers’.
Costs of multiline and grok
Be aware that some features of Logstash are more expensive than others.
For example, collapsing multiline events is much better done at the Filebeat level, instead of needing Logstash to track incoming event streams.
Regular expressions are very CPU intensive, and can easily saturate a Logstash host. The only real way to evaluate performance is to run load tests, but go through some concepts in this article ,this one, and this one.
Performance Checklist
Go through the checklist provided on Elastic.co to determine if CPU, Memory, I/O, or JVM heap are an issue.
REFERENCES
https://www.elastic.co/guide/en/logstash/current/performance-troubleshooting.html
https://www.elastic.co/blog/a-history-of-logstash-output-workers
https://www.elastic.co/blog/logstash-configuration-tuning
http://svops.com/blog/logstash-best-practices/
http://www.slideshare.net/LucasEwalt/elasticsearch-logstash-and-kibana-at-scale