![]() The most varied point in an ELK (Elasticsearch-Logstash-Kibana) stack is the mechanism by which custom events and logs will get sent to Logstash for processing.
The most varied point in an ELK (Elasticsearch-Logstash-Kibana) stack is the mechanism by which custom events and logs will get sent to Logstash for processing.
Companies running Java applications with logging sent to log4j or SLF4J/Logback will have local log files that need to be tailed. Applications running in containers may send everything to stdout/stderr, or have drivers for sending this on to syslog and other locations. Network appliances tend to have SNMP or remote syslog outputs.
But regardless of the details, events must flow from their source to the Logstash indexing layer. Doing this with maximized availability and scalability, and without putting excessive pressure on the Logstash indexing layer is the primary concern of this article.
Overview
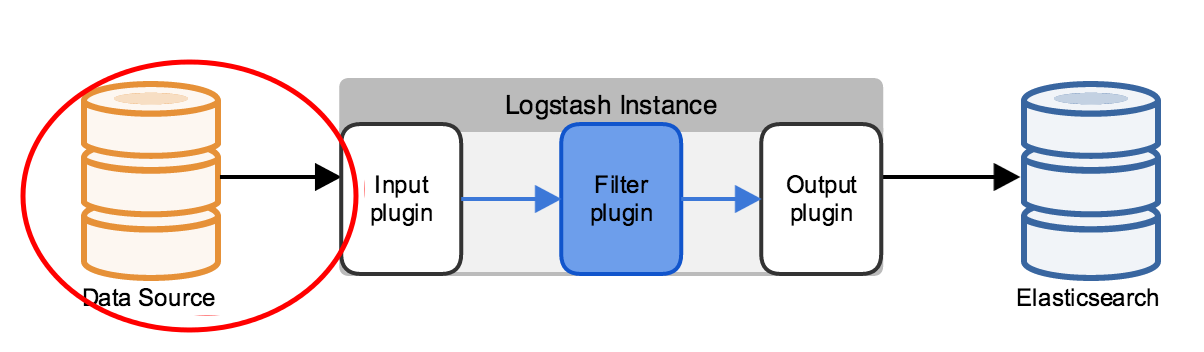
Going back to the simplest possible logical deployment of ELK, this article is focused on the area circled in red from the diagram below. From the Data Source up to (but not including) the Logstash indexing layer.
Maximize client processing with local agent
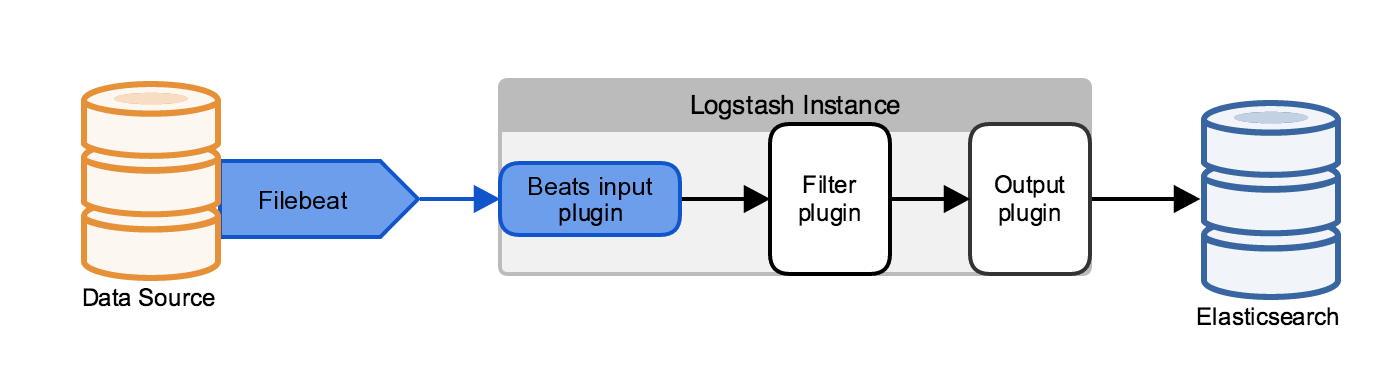
If you have local log files or have configured your applications to send events to local syslog files, one of the easiest steps to take is to install a lightweight agent on the log source that tails the local file, and then forwards it to various outputs.
We will talk mainly about the lightweight data shipper from Elasticsearch.co called Filebeat, but the Logstash indexing layer is more than capable of accepting events from Fluentd, NXLog, and a multitude of sources using both official and community supported plugins.
From a scalability perspective, the ability of a local agent to do simple filtering and processing before forwarding is a huge benefit. Instead of the Logstash indexing layer having to take responsibility for blocking operation such as multi-line processsing, this can be done at the local level. And using processors, events can be dropped on condition, or fields can be added or dropped. Other agents such as Fluentd can take on even more complex transformations and regex field extractions, all of which means less work at the Logstash indexing layer.
Filebeat also has built in delivery tracking and availability control which means that if the output (whether Logstash, Kafka, or Redis) goes down, events will not be lost and the agent will wait until the output service is back online. This is a considerable benefit when compared to something like log4j sending directly to syslog that would simply lose events and not care.
Managing spikes in throughput
Given a growing number of events, at some point no matter how much preprocessing you do at the data source nodes, the Logstash indexing layer will sense that it’s rate of transformation is not keeping up with the incoming events. It will then throttle itself, and not allow incoming events.
If this higher throughput rate is constant, you need to horizontally scale the Logstash indexing layer. But typically, you can help smooth out temporary spikes from what might be a nightly check batch job, or 9.a.m. peak login time for a customer facing application by inserting a message queue between the data source and Logstash indexing layer.
The queue absorbs the spikes during periods of high load and allows the data sources to continue to send at full capacity even if the Logstash indexing layer is lagging a bit behind.
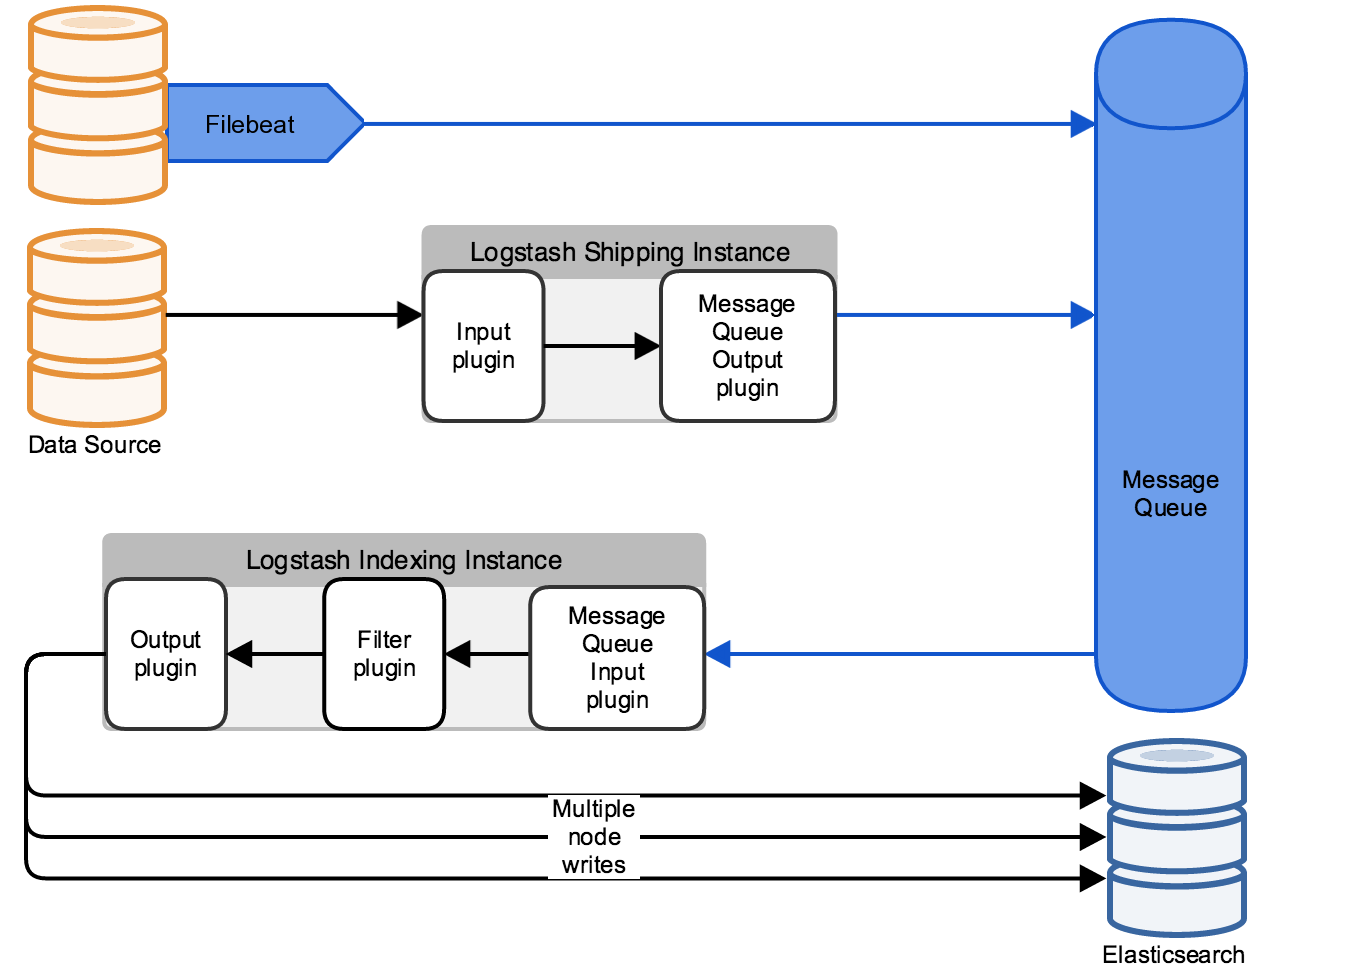
The diagram above shows two scenarios. The first is a simple implementation where Filebeat sends directly to the message queue (let’s assume Redis or Kafka), and then the Logstash Indexing layer would consume from the queue at the highest rate possible.
But it also shows another scenario where you can use Logstash as Shipping layer. This shipping layer (which is distinct from the Logstash Indexing layer) should only do minimal preprocessing, and is used to take advantage of Logstash’s rich set of input/ouput codecs.
Load balancing
In all the designs above, load balancing needs should be designed and tailored to your specific needs.
For example, how do you ensure Filebeat can send to your 3 node Redis cluster? You could assign multiple Redis hosts in the filebeat.yml which will allow failover and load balancing:
output.redis:
  hosts: ["redis-node1","redis-node2","redis-node3"]
  loadbalance: true
But you could also use a round-robin DNS or HAproxy and Redis sentinel to front a DNS name to a Redis cluster, and then only specify the fronting Redis DNS name:
output.redis:
  hosts: ["redis-cluster"]
The same concept applies to multiple hosts in your Logstash shipping layer and are the type of decisions that you alone can make for your environment based on how much time and operational expertise you have available.
Summary
In this article, we’ve gone over several methods of gathering source events and sending them to the Logstash Indexing layer and the scale and availability concerns involved.
REFERENCES
https://www.elastic.co/guide/en/logstash/current/deploying-and-scaling.html
https://www.elastic.co/guide/en/logstash/current/input-plugins.html
https://www.elastic.co/guide/en/beats/filebeat/current/configuration-processors.html
https://www.elastic.co/guide/en/beats/filebeat/current/filebeat-configuration-details.html
https://gist.github.com/shreyu86/735f2871460a2b068080
https://docs.docker.com/engine/admin/logging/overview/