![]() ElasticSearch’s commercial X-Pack has alerting functionality based on ElasticSearch conditions, but there is also a strong open-source contender from Yelp’s Engineering group called ElastAlert.
ElasticSearch’s commercial X-Pack has alerting functionality based on ElasticSearch conditions, but there is also a strong open-source contender from Yelp’s Engineering group called ElastAlert.
ElastAlert offers developers the ultimate control, with the ability to easily create new rules, alerts, and filters using all the power and libraries of Python.
Installation
The first step is to make sure you have Python 2.x, and various development OS and pip dependency libraries installed. Then grab the git project, and install it. Here is an augmented version of the official documentation that gets the correct dependencies for Ubuntu 14.04.
$ python --version

$ cd /tmp

$ sudo apt-get install git software-properties-common python python-pip -y

$ sudo apt-get install python-dev libffi-dev libssl-dev -y

$ sudo pip install "setuptools>=11.3"

$ git clone https://github.com/Yelp/elastalert.git

$ cd elastalert

$ sudo python setup.py install
Now, depending on the ElasticSearch server version, install the correct pip library.
$ wget -qO - http://elasticsearch:9200 | grep number

$ pip list | grep elasticsearch
For ElasticSearch 2.x:
$ sudo pip install "elasticsearch<3.0.0"
For ElasticSearch 5.x:
$ sudo pip install "elasticsearch>=5.0.0"
As a sanity test of the pip libraries, invoke the executable and it should throw a stack exception saying “No such file or directory: config.yaml”, but it should not throw any exceptions about libraries or dependency modules.
$ /usr/local/bin/elastalert
Configuration
The main configuration is done in config.yaml.
$ cp config.yaml.example config.yaml

$ vi config.yaml
At the minimum, make sure to change the ‘es_host’ key to point to your ElasticSearch server, but we will also have ElastAlert check for our rule conditions every 10 seconds for debugging purposes.
run_every:
  seconds: 10
es_host: esmaster
es_port: 9200
Notice that by default, ElastAlert will be executing against all the rules in ‘rules_folder: examples_rules’.
ElasticSearch Index Creation
ElastAlert saves information about its queries/alerts back to an ES index named ‘elastalert_status’, create this index using the following commands. Press <ENTER> twice to accept the default index name and question asking about name of existing index.
$ python elastalert/create_index.py
Before moving on, we want to validate that ElastAlert can load all the python libraries and example rules properly. You first need to fix a known issue and modify the “example_rules/example_new_term.yaml” file and change its name so it doesn’t conflict with another rule. Change it to “name: Example rule New Term”.
Then run the below which will load all the example rules and print out a json structure showing all the rule definitions.
$ /usr/local/bin/elastalert --debug
ElasticSearch Trigger Condition
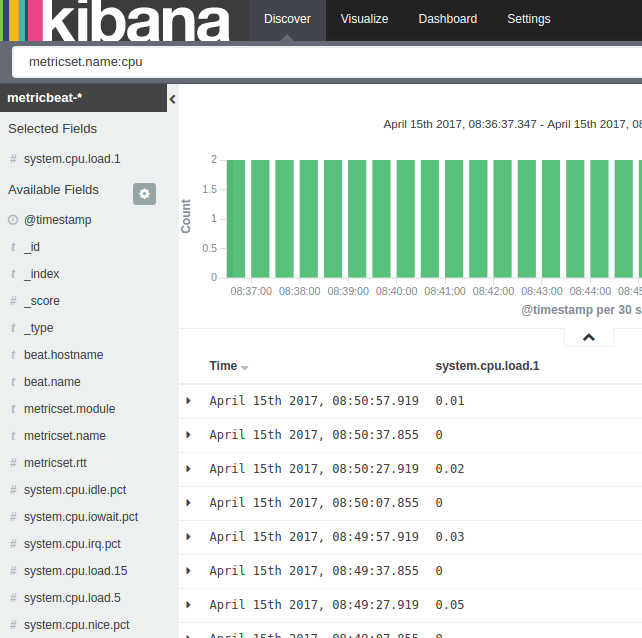
For purposes of this article, we are going to create a rule that alerts us when the CPU load of a host goes over a threshold. We will gather this information using the MetricBeat agent created by ElasticSearch.
For details on installing MetricBeat on Ubuntu, read my article here. After successfully installed, you should see cpu/memory/disk/network data inserted into the ‘metricbeat-YYYY.MM.DD’ index.
Specifically, you can filter on events where “metricset.name:cpu” and those events will have a “system.cpu.load.1” field which represents the CPU load over the last minute. Below is an example of that view, but with very low CPU utilization as the machine is idle at the moment.
Custom Rule
Now we are going to create the custom rule that alerts us when CPU load is greater than 1.0 which assumes a single CPU (load value explained). There is an example rule that we can use as a template:
$ cp example_rules/example_single_metric_agg.yaml cpu_high.yaml
and modify cpu_high.yaml to look like:
name: Metricbeat CPU Spike Rule
type: metric_aggregation

index: metricbeat-*

buffer_time:
minutes: 1

metric_agg_key: system.cpu.load.1
metric_agg_type: avg
query_key: beat.hostname
doc_type: metricsets

bucket_interval:
minutes: 1

sync_bucket_interval: true
#allow_buffer_time_overlap: true
#use_run_every_query_size: true

min_threshold: 0.0
max_threshold: 1.0

filter:
- term:
  metricset.name: cpu

# The debug alert is use when a match is found
alert:
  - "debug"
Now we can validate the rule and have it do a quick dry run:
$ sudo pip install pytest

$ python -m elastalert.test_rule cpu_high.yaml
Running from the console
Now it’s time to run ElastAlert using our custom rule:
$ python -m elastalert.elastalert --verbose --rule cpu_high.yaml
Every 10 seconds the rule will be run and you should see:
INFO:elastalert:Ran Metricbeat CPU Spike Rule from 2017-04-16 02:53 UTC to 2017-04-16 02:53 UTC: 0 query hits (0 already seen), 0 matches, 0 alerts sent
Then from the host where you have MetricBeat installed and reporting back every 30 seconds, run the ‘stress’ program that will create a load on the CPU:
$ sudo apt-get install stress -y

$ stress --cpu 4
When you load the CPU of the MetricBeat host, after 60 seconds or so you should see a message like this which indicates that the threshold has been reached. In this article, we only have our alert going to the console, but you are free to send this to any of the alerting modules (SMTP, JIRA, Slack, PagerDuty, etc)
INFO:elastalert:Sleeping for 9.994223 seconds
INFO:elastalert:Skipping writing to ES: {'rule_name': u'Metricbeat CPU Spike Rule.lstash1', '@timestamp': '2017-04-16T02:54:07.993044Z', 'exponent': 0, 'until': '2017-04-16T02:55:07.993019Z'}
 INFO:elastalert:Alert for Metricbeat CPU Spike Rule, lstash1 at 2017-04-16T02:53:00Z:
 INFO:elastalert:Metricbeat CPU Spike Rule

Threshold violation, avg:system.cpu.load.1 2.05499994755 (min: 0.0 max : 0.8)

@timestamp: 2017-04-16T02:53:00Z
 beat.hostname: lstash1
 num_hits: 40277
 num_matches: 1
 system.cpu.load.1_avg: 2.05499994755

INFO:elastalert:Skipping writing to ES: {'hits': 40277, 'matches': 1, '@timestamp': '2017-04-16T02:54:07.998298Z', 'rule_name': 'Metricbeat CPU Spike Rule', 'starttime': '2017-04-16T02:53:00.471872Z', 'endtime': '2017-04-16T02:54:00.471872Z', 'time_taken': 0.019961833953857422}
Running as a service
If you want to explore running this as a service, you can read my article here. The module dependencies are complex, so when running as a service we take the approach of running inside a Python virtualenv.
REFERENCES
https://github.com/Yelp/elastalert
http://elastalert.readthedocs.io/en/latest/index.html
https://engineeringblog.yelp.com/2015/10/elastalert-alerting-at-scale-with-elasticsearch.html
https://engineeringblog.yelp.com/amp/2016/03/elastalert-part-two.html
https://bitsensor.io/blog/elastalert-kibana-plugin-centralized-logging-with-integrated-alerting
https://git.bitsensor.io/front-end/elastalert-kibana-plugin
https://github.com/Yelp/elastalert/blob/master/docs/source/ruletypes.rst
https://holdmybeer.xyz/2016/12/05/part-1-installsetup-wazuh-with-elk-stack/
https://github.com/elastic/kibana/issues/678
https://www.timroes.de/2015/02/07/kibana-4-tutorial-part-3-visualize/
http://www.hecticgeek.com/2012/11/stress-test-your-ubuntu-computer-with-stress/
https://github.com/Yelp/elastalert/issues/231
https://alexandreesl.com/2016/04/15/elastalert-implementing-rich-monitoring-with-elasticsearch/
https://unix.stackexchange.com/questions/118124/why-how-does-uptime-show-cpu-load-1
At one time, needed awscli before running create_index.py
sudo pip install awscli
alternate for running /usr/local/bin/elastalert
$ python -m elastalert.elastalert --debug
branch for pull request
$ git clone https://github.com/fabianlee/elastalert.git -b fabianlee_requirements_change