 ElasticSearch’s Metricbeat is a lightweight shipper of both system and application metrics that runs as an agent on a client host. That means that along with standard cpu/mem/disk/network metrics, you can also monitor Apache, Docker, Nginx, Redis, etc. as well as create your own collector in the Go language.
In this article we will describe installing Metricbeat 5.x on Ubuntu when the back end ElasticSearch version is either 5.x or 2.x.
Agent Installation
Start by adding the GPG key and adding the ES repository:
$ wget -qO - https://artifacts.elastic.co/GPG-KEY-elasticsearch | sudo apt-key add -

$ sudo apt-get install apt-transport-https ca-certificates -y

$ echo "deb https://artifacts.elastic.co/packages/5.x/apt stable main"| sudo tee -a /etc/apt/sources.list.d/elastic-5.x.list
Then refresh the repository and install Metricbeat:
$ sudo apt-get update
$ sudo apt-cache policy metricbeat
$ sudo apt-get install metricbeat
The System-V init script links are already present so there is no need to run update-rc.d as stated in the official docs. You can see those links using ‘sudo ls /etc/rc*.d | grep metricbeat’.
If during the apt-get update, there is an error stating ‘The following signatures couldn’t be verified because the public key is not available: NO_PUBKEY …’, then you need to add the ElasticSearch signing key to the trusted keys
$ sudo apt-key adv --keyserver hkp://pgp.mit.edu:80 --recv D88E42B4
Server Index Configuration
Next, we need to tell ElasticSearch how to interpret and analyze the data that Metricbeat will be sending. This json file comes with Metricbeat, and we will submit it to the server.
$ sudo apt-get install curl -y
$ curl http://esmaster1:9200
The curl to the base ElasticSearch port will return general information about the ES server including the version (“number”). Now load the index settings according to the ES version.
For ElasticSearch 2.x
$ curl -XPUT 'http://esmaster1:9200/_template/metricbeat' -d@/etc/metricbeat/metricbeat.template.json
{"acknowledged":true}
For Elasticsearch 5.x
$ curl -XPUT 'http://esmaster1:9200/_template/metricbeat' -d@/etc/metricbeat/metricbeat.template-es2x.json
{"acknowledged":true}
If you need to validate which index is active you can retrieve it:
$ curl -XGET 'http://esmaster1:9200/_template/metricbeat' | python -m json.tool | more
An easy way to tell the difference between the 2.x and 5.x versions is that in the first few lines it defines the normalization factors using the key “norms”. For the ElasticSearch 5.x settings, you will see:
"norms": false
While in the ElasticSearch 2.x settings, you will see:
"norms": { "enabled": false }
Agent Configuration
Now we configure the Metricbeat agent at ‘/etc/metricbeat/metricbeat.yml’. The only mandatory change is to change the output.elasticsearch.hosts it points to, but I’ve also tweaked it so it does not monitor all processes, collects every 30 seconds, and logs to an explicit location with rotation.
metricbeat.modules:
- module: system
  metricsets:
  # CPU stats
  - cpu

 # System Load stats
 - load

 # Per CPU core stats
 #- core

 # IO stats
 #- diskio

 # Per filesystem stats
 - filesystem

 # File system summary stats
 - fsstat

 # Memory stats
 - memory

 # Network stats
 - network

 # Per process stats
 - process

 # Sockets (linux only)
 #- socket
 enabled: true
 period: 30s
 #processes: ['.*']

 # filter NIC
 # https://www.elastic.co/guide/en/beats/metricbeat/current/metricbeat-metricset-system-network.html\
 #interfaces: [eth0]


#========== General

# name: myhostname

# tags: ["service-X","web-tier"]

# fields:
#   datacenter: US
#   env: dev

#========== Outputs

output.elasticsearch:
  hosts: ["esmaster1:9200"]

#========== Logging

logging:
  level: debug
  to_files: true
  to_syslog: false
  files:
  path: /var/log/mybeat
  name: metricbeat.log
  keepfiles: 7
Run the Metricbeat Agent
Now we are ready to start the agent.
$ sudo service metricbeat start
And activity can be monitored in the log:
$ tail -f /var/log/metricbeat/metricbeat
If you are getting successful publishing to the ElasticSearch server, you will see messages like:
2017-04-16T16:19:19Z DBG PublishEvents: 25 events have been published to elasticsearch in 16.12336ms
And if there are issues sending the data, you will see messages like:
2017-04-16T16:20:27Z ERR Connecting error publishing events (retrying): Get http://esmaster1:9200: lookup esmaster1: no such host
Validate in ElasticSearch
You can verify that the ‘metricbeat-YYYY.MM.DD’ index is being populated by querying for the last few records, or asking for a total count.
$ sudo apt-get install curl -y
$ curl -XGET 'http://esmaster1:9200/metricbeat-*/_search?pretty=true&q=*:*&size=2'
$ curl -XGET 'http://esmaster1:9200/metricbeat-*/_count'
Validate from Kibana
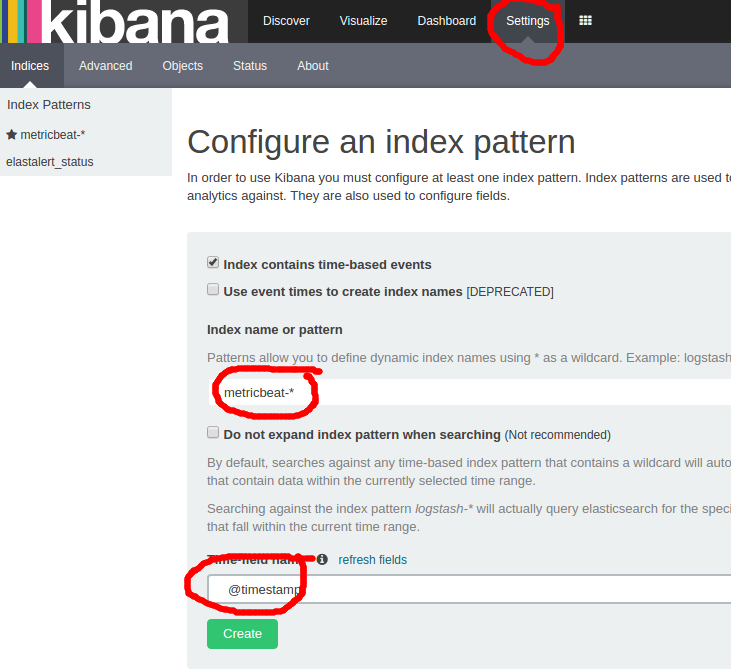
If you have an instance of Kibana, you need to first add the index by going to Settings. Use the pattern “metricbeat-*”, select “@timestamp” for the time-field name, and press “Create”.

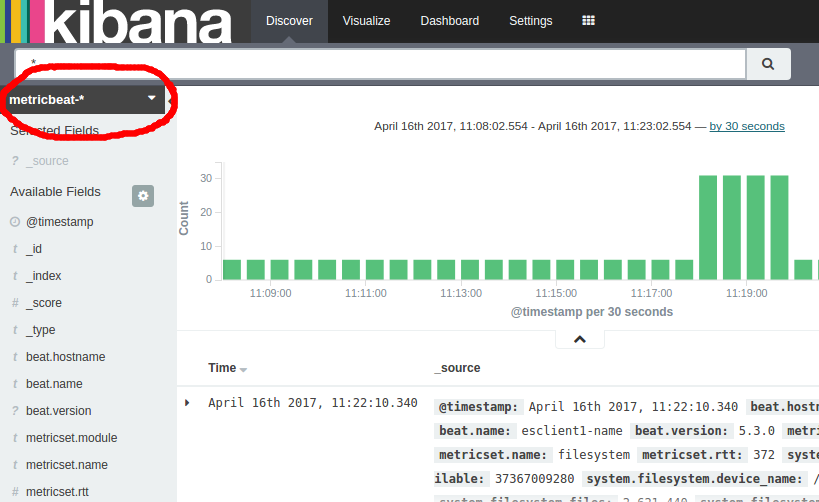
Now you should be able to go to “Discover” and on the left hand column, you will find a “metricbeat-*” data source. When you select this, it will show you the latest data from those indices.

REFERENCES
https://www.elastic.co/guide/en/beats/metricbeat/current/metricbeat-installation.html
https://www.elastic.co/guide/en/beats/metricbeat/current/setup-repositories.html
https://www.elastic.co/guide/en/beats/metricbeat/current/creating-metricsets.html
http://stackoverflow.com/questions/8829468/elasticsearch-query-to-return-all-records
https://www.elastic.co/guide/en/elasticsearch/reference/current/search-count.html