![]() Java JMX (Java Management Extensions) is a standardized way of monitoring Java based applications. The managed resources (MBeans) are defined and exposed by the JVM, application server, and application – and offer a view into these layers that can provide invaluable monitoring data.
Java JMX (Java Management Extensions) is a standardized way of monitoring Java based applications. The managed resources (MBeans) are defined and exposed by the JVM, application server, and application – and offer a view into these layers that can provide invaluable monitoring data.
But in order to report back the JMX data you must know the fully expanded path of the MBean and it’s available attributes/operations. If you are on a desktop, tools like jsonsole provide a nice GUI interface for drilling down into the MBean hierarchy. But, if you are in a server environment and JMX is not enabled for remote access on a desktop, you may need a console alternative.
An open-source project call jmxterm comes packaged as a single uber jar that makes it easy to enumerate and explore the available MBean exposed in a Java based application.
The jmxterm project is no longer actively developed, but JMX has been a stable API for a long time and the code is still fully capable under Java 8, so I see no issue in continuing to use it for operational purposes as we will in this article.
MBean for Tomcat7
Enabling JMX for Tomcat running as a service is beyond the scope of this article, but for Ubuntu you can modify /etc/default/tomcat7, and for Windows you can modify the registry directly or use tomcat7w.exe.
Assuming you have configured JMX on port 9991 with no authentication, you can attempt a connection by invoking the application and issuing an ‘open’ command such as below:
> java -jar jmxterm-1.0-alpha-4-uber.jar
Welcome to JMX terminal. Type "help" for available commands.
$>open localhost:9991
#Connection to localhost:9991 is opened
Now, you want to get a high level view of what MBean are available, so type ‘beans’ and you will get back a long list (snippet below):
java.lang:name=CMS Old Gen,type=MemoryPool
java.lang:name=CMS Perm Gen,type=MemoryPool
java.lang:name=Code Cache,type=MemoryPool java.lang:name=CodeCacheManager,type=MemoryManager java.lang:name=ConcurrentMarkSweep,type=GarbageCollector java.lang:name=Copy,type=GarbageCollector
java.lang:name=Eden Space,type=MemoryPool
java.lang:name=Survivor Space,type=MemoryPool java.lang:type=ClassLoading
java.lang:type=Compilation java.lang:type=Memory
java.lang:type=OperatingSystem
java.lang:type=Runtime
java.lang:type=Threading
Each of these lines represents an MBean that has methods/values that we can query. Let’s look deeper into a simple MBean that exposes the total uptime of the JMV, ‘java.lang:type=Runtime’.
$> bean java.lang:type=Runtime
#bean is set to java.lang:type=Runtime
Now we list the attributes/operations available using the ‘info’ command:
$>info
#mbean = java.lang:type=Runtime
#class name = sun.management.RuntimeImpl
# attributes
  %0   - BootClassPath (java.lang.String, r)
  %1   - BootClassPathSupported (boolean, r)
  %2   - ClassPath (java.lang.String, r)
  %3   - InputArguments ([Ljava.lang.String;, r)
  %4   - LibraryPath (java.lang.String, r)
  %5   - ManagementSpecVersion (java.lang.String, r)
  %6   - Name (java.lang.String, r)
  %7   - ObjectName (javax.management.ObjectName, r)
  %8   - SpecName (java.lang.String, r)
  %9   - SpecVendor (java.lang.String, r)
  %10  - SpecVersion (java.lang.String, r)
  %11  - StartTime (long, r)
  %12  - SystemProperties (javax.management.openmbean.TabularData, r)
  %13  - Uptime (long, r)
  %14  - VmName (java.lang.String, r)
  %15  - VmVendor (java.lang.String, r)
  %16  - VmVersion (java.lang.String, r)
#there's no operations
#there's no notifications
Notice the 13th attribute named ‘Uptime’ (case sensitive), let’s pull that value:
$>get Uptime
#mbean = java.lang:type=Runtime:
Uptime = 892571;
And a few seconds later we issue the same get and notice that the value has already increased.
$>get Uptime
#mbean = java.lang:type=Runtime:
Uptime = 948341;
There are many Tomcat standard MBean you can monitor as documented here. And your monitoring system will typically already have a Tomcat template that can be used.
But these are the standard JVM and Tomcat MBean, and your web applications (war) may expose additional MBean that can be queried for key performance indicators or other internal diagnostics. For example, the spring-framework-petclinic exposes a bean named ‘petclinic:type=CallMonitor’, that exposes attributes named getCallCount and getCallTime.
MBean for Cassandra
Just like Tomcat, Cassandra also has a standard set of MBean that can be monitored. By default, Cassandra is configured to accept only local JMX (not remote) connections on port 7199.
Connecting and then listing the beans like below will provide a very long list of available beans. These are described in this wiki.
$ java -jar jmxterm-1.0-alpha-4-uber.jar
Welcome to JMX terminal. Type "help" for available commands.
$>open localhost:7199
#Connection to localhost:7199 is opened
$>beans
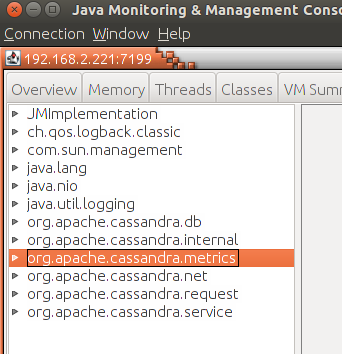
If represented graphically using jconsole, the list would look like the screenshot below. In 2.2 and newer versions of Cassandra, you’ll want to look under ‘org.apache.cassandra.metrics’ for the metrics.
For example, from jmxterm selecting the read latency bean ‘org.apache.cassandra.metrics:type=ClientRequest,scope=Read,name=Latency’:
$>bean org.apache.cassandra.metrics:type=ClientRequest,scope=Read,name=Latency
$> info
And then asking for its attributes with ‘info’ will return:
#mbean = org.apache.cassandra.metrics:type=ClientRequest,scope=Read,name=Latency
#class name = org.apache.cassandra.metrics.CassandraMetricsRegistry$JmxTimer
# attributes
  %0   - 50thPercentile (double, r)
  %1   - 75thPercentile (double, r)
  %2   - 95thPercentile (double, r)
  %3   - 98thPercentile (double, r)
  %4   - 999thPercentile (double, r)
  %5   - 99thPercentile (double, r)
  %6   - Count (long, r)
  %7   - DurationUnit (java.lang.String, r)
  %8   - FifteenMinuteRate (double, r)
  %9   - FiveMinuteRate (double, r)
  %10  - Max (double, r)
  %11  - Mean (double, r)
  %12  - MeanRate (double, r)
  %13  - Min (double, r)
  %14  - OneMinuteRate (double, r)
  %15  - RateUnit (java.lang.String, r)
  %16  - StdDev (double, r)
# operations
  %0   - javax.management.ObjectName objectName()
  %1   - [J values()
#there's no notifications
And then you can pull any of these attributes, such as ‘Mean’:
$>get Mean
get Mean
#mbean = org.apache.cassandra.metrics:type=ClientRequest,scope=Read,name=Latency:
Mean = 43388.628000000004;
REFERENCES
http://docs.oracle.com/javase/tutorial/jmx/
http://docs.oracle.com/javase/7/docs/technotes/guides/management/jconsole.html
http://www.oracle.com/us/technologies/java/best-practices-jsp-136021.html
https://github.com/m-szalik/tjconsole
https://gist.github.com/clstokes/3784425
http://www.informit.com/articles/article.aspx?p=2169293&seqNum=2
https://docs.datastax.com/en/cassandra/2.1/cassandra/security/secureJmxAuthentication.html
https://www.datadoghq.com/blog/how-to-collect-cassandra-metrics/