![]() If you are running the Prometheus Operator as part of your monitoring stack (e.g. kube-prometheus-stack) then you can have your custom Service monitored by defining a ServiceMonitor CRD.
If you are running the Prometheus Operator as part of your monitoring stack (e.g. kube-prometheus-stack) then you can have your custom Service monitored by defining a ServiceMonitor CRD.
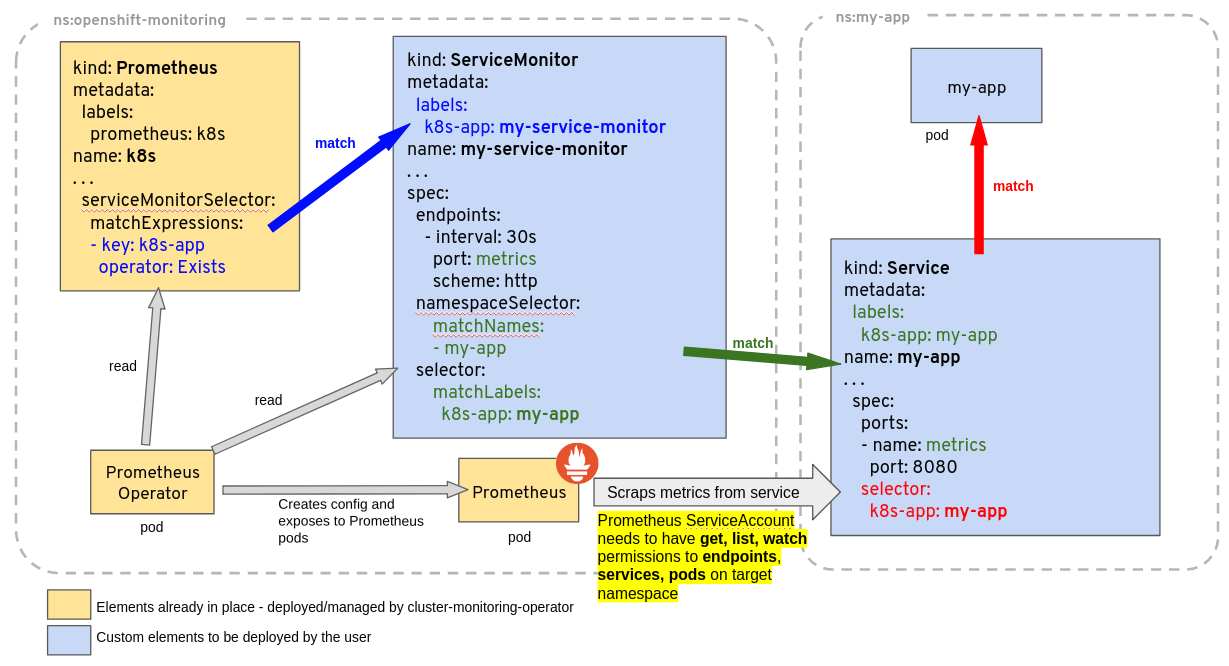
The ServiceMonitor is an object that defines the service endpoints that should be scraped by Prometheus and at what interval.
In this article, we will deploy a custom REST app and Service that exposes Prometheus metrics to Kubernetes. We will then create a ServiceMonitor object which instructs Prometheus on how to scrape the metric, and then a PrometheusRule that can alert on that metric value.
Prometheus Operator prerequisite
In order to use a ServiceMonitor, you need a Kubernetes cluster that has the Prometheus Operator installed. You can get the name and namespace of this object with the commands below.
# get namespace and name of Prometheus CRD
$ kubectl get prometheus -A
NAMESPACE NAME VERSION REPLICAS AGE
prom prom-stack-kube-prometheus-prometheus v2.36.1 1 4d22h

# query object to find labels needed for ServiceMonitor
$ kubectl get prometheus -n prom prom-stack-kube-prometheus-prometheus -o=jsonpath='{.spec.serviceMonitorSelector}'
{"matchLabels":{"release":"prom-stack"}}
The ‘serviceMonitorSelector’ matchLabels will be required in a later section when we define the ServiceMonitor.
Deploy custom Deployment and Service
We will use a small Spring Boot REST service to illustrate the use of a Prometheus ServiceMonitor. Clone my github project as shown below to pull the required Kubernetes manifests for this article.
# get my sample project from github
git clone https://github.com/fabianlee/spring-boot-with-docker-push.git
cd spring-boot-with-docker-push/src/main/resources/kubernetes

# deploy 'spring-boot-with-docker-push' app into kubernetes
sed 's/<%=version%>/0.0.2-SNAPSHOT/' deployment-and-service.yaml | kubectl apply -f -

# wait for, then validate Deployment
$ kubectl wait deployment spring-boot-with-docker-push --for condition=Available=True --timeout=90s
$ kubectl get deployment spring-boot-with-docker-push
NAME READY UP-TO-DATE AVAILABLE AGE
spring-boot-with-docker-push 1/1 1 1 156m

# validate that Service exists now
$ kubectl get service spring-boot-with-docker-push
NAME TYPE CLUSTER-IP EXTERNAL-IP PORT(S) AGE
spring-boot-with-docker-push ClusterIP 10.43.226.114 <none> 8080/TCP,8081/TCP 157m
For this article, to avoid variations in loadbalancer and Ingress, let’s just expose this service main port 8080 and its 8081 management port using local port forwarding.
# background process to forward main service to localhost:8080, save PID
kubectl port-forward deployment/spring-boot-with-docker-push 8080:8080 > /dev/null &
PF_PID8080=$!

# background process to forward mgmt actuator to localhost:8081, save PID
kubectl port-forward deployment/spring-boot-with-docker-push 8081:8081 > /dev/null &
PF_PID8081=$!
Validate endpoints
This service is a REST based application that manages a list of users on its main port 8080. It exposes a set of health and Prometheus metrics on its management port of 8081. Here is a list of its endpoints:
- GET http://localhost:8080/api/user – lists all users
- DELETE http://localhost:8080/api/users – deletes user from list
- GET http://localhost:8081/actuator/health – overall health of service, UP if user count is greater than 0
- GET http://localhost:8081/actuator/prometheus – set of metrics for prometheus scraping
Use curl to test each of these endpoints, and get a sense of its functionality.
# get list of end users (3 initially)
$ curl -X GET http://localhost:8080/api/user
[{"name":"moe"},{"name":"larry"},{"name":"curly"}]

# delete a user
$ curl -X DELETE http://localhost:8080/api/user

# get list of end users (2 now)
$ curl -X GET http://localhost:8080/api/user
[{"name":"moe"},{"name":"larry"}]

# get overall health from management health status
$ curl -s http://localhost:8081/actuator/health | jq .status
"UP"

# get user count from management prometheus metrics
$ curl -s http://localhost:8081/actuator/prometheus | grep ^usercontroller_usercount
usercontroller_usercount{version="v1",} 2.0
Create ServiceMonitor
All the pieces are in place for us to create a ServiceMonitor that tells the Prometheus Operator how to scrape these metrics. Here is the general syntax.
apiVersion: monitoring.coreos.com/v1
kind: ServiceMonitor
metadata:
  labels:
    release: prom-stack
  name: spring-boot-with-docker-push
spec:
  endpoints:

  - path: /actuator/prometheus
    port: http-actuator-metrics
    scheme: http
    interval: 60s

  jobLabel: spring-boot-with-docker-push
  namespaceSelector:
    matchNames:
    - default
  selector:
    matchLabels:
      app: spring-boot-with-docker-push
Notice that the ServiceMonitor metadata.labels has the ‘release: prom-stack’ label. This is to match the values from the first section of this article where we pull the matchLabels from the Prometheus Operator.
The spec.selector.matchLabels is to select the Service we want to monitor. The official docs have a diagram illustrating these relationships.
Deploy the ServiceMonitor using the provided yaml manifest.
# apply to cluster
kubectl apply -f servicemonitor.yaml

# validate
$ kubectl get ServiceMonitor
NAME AGE
spring-boot-with-docker-push 3h
Validate custom metric in Prometheus
Our scrape interval was defined as 60 seconds, so within about a minute we should be able to login to the Prometheus UI and check for the ‘usercontroller_usercount’ metric.
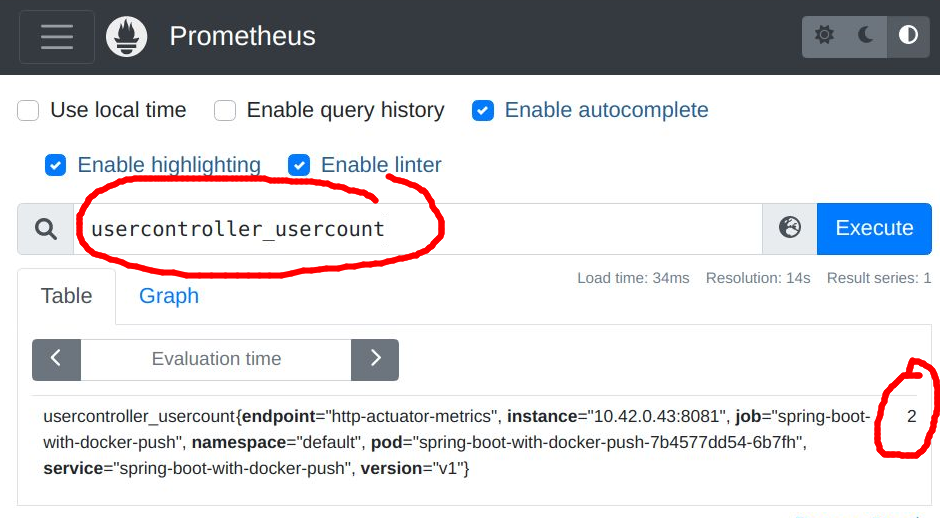
This is the same value we saw earlier from a curl against ‘/actuator/prometheus’ for the ‘usercontroller_usercount’ metric.
Create PrometheusRule
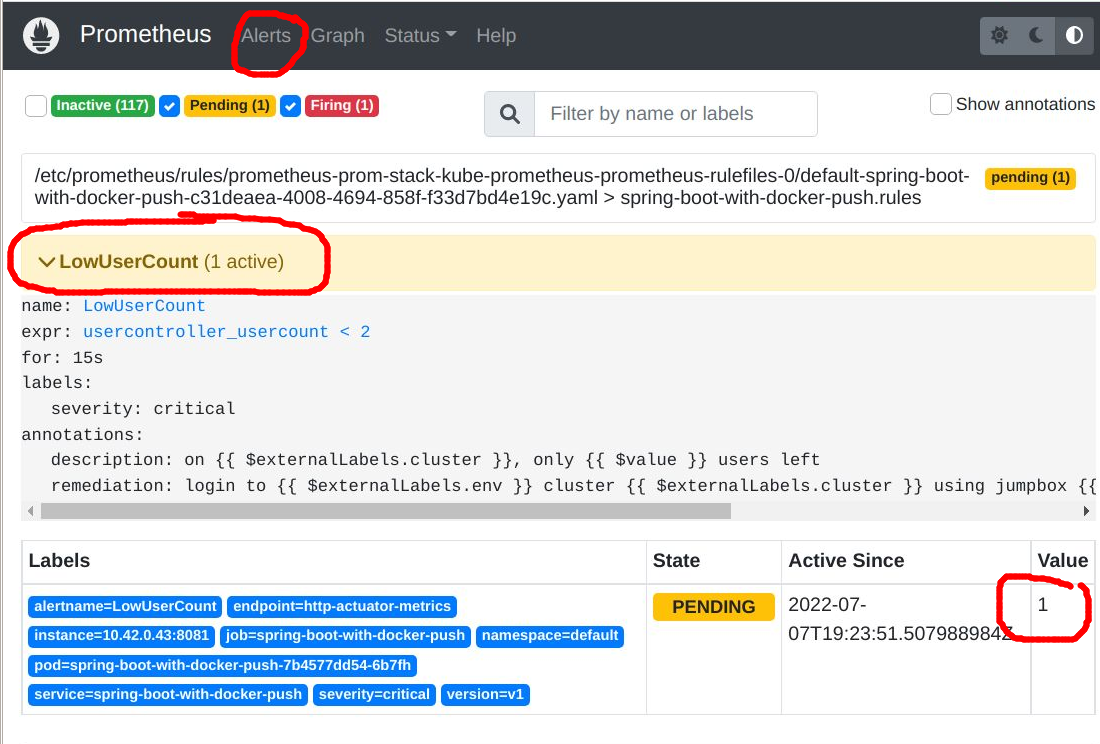
Taking it one step further, if you want to take action when this metric goes below a certain threshold, you can use a PrometheusRule object. Let’s say we want Prometheus to alert when the user count reaches a critical level of 1 (only a single user left).
We need to create a PrometheusRule with the syntax below, making sure to craft the ‘expr’ with the proper trigger expression.
apiVersion: monitoring.coreos.com/v1
kind: PrometheusRule
metadata:
  name: spring-boot-with-docker-push
  namespace: default
spec:
  groups:
  - name: spring-boot-with-docker-push.rules
    rules:

    - alert: LowUserCount
      annotations:
        description: on {{ $externalLabels.cluster }}, only {{ $value }} users left
        remediation: login to {{ $externalLabels.env }} cluster {{ $externalLabels.cluster }} using jumpbox {{ $externalLabels.jumpbox }} and provision more Users
      expr: usercontroller_usercount{}<2
      for: 15s # 1m
      labels:
        severity: critical
Now let’s delete another user so that the list goes from 2 to 1, which will trigger this alert.
# delete a user
$ curl -X DELETE http://localhost:8080/api/user

# get list of end users, only 1 now!!! which triggers the rule
$ curl -X GET http://localhost:8080/api/user
[{"name":"moe"}]
Wait for another 60 seconds to give enough time for this new value to be scraped, and then when you go to the Prometheus UI “Alerts” section, you should see this pending alert.
Clearing Alert
The deployment manifest for this application has its livenessProbe set to ‘:8081/actuator/health’. We currently have a usercount=1, and so the health reports back “UP”.
BUT if we deleted one more user, the usercount would go to 0 and the health would report “DOWN”, forcing Kubernetes to restart the pod.
Restarting the pod will set the usercount value back to its original 3 users, clearing the alert.
# get overall health from management health status
$ curl -s http://localhost:8081/actuator/health | jq .status
"UP"

# delete the last user
$ curl -X DELETE http://localhost:8080/api/user

# get list of end users, 0 now
$ curl -X GET http://localhost:8080/api/user
[]

# overall health now failing
$ curl -s http://localhost:8081/actuator/health | jq .status
"DOWN"

# wait 45 seconds for Kubernetes to sense failure and recreate pod
sleep 45

# get list of end users, back to initial 3 because pod recreated
$ curl -X GET http://localhost:8080/api/user
[{"name":"moe"},{"name":"larry"},{"name":"curly"}]

# overall health good again
$ curl -s http://localhost:8081/actuator/health | jq .status
"UP"
And if you go to the “Alerts” section of the Prometheus UI, you will once again see there is no ‘LowUserCount’ alert.
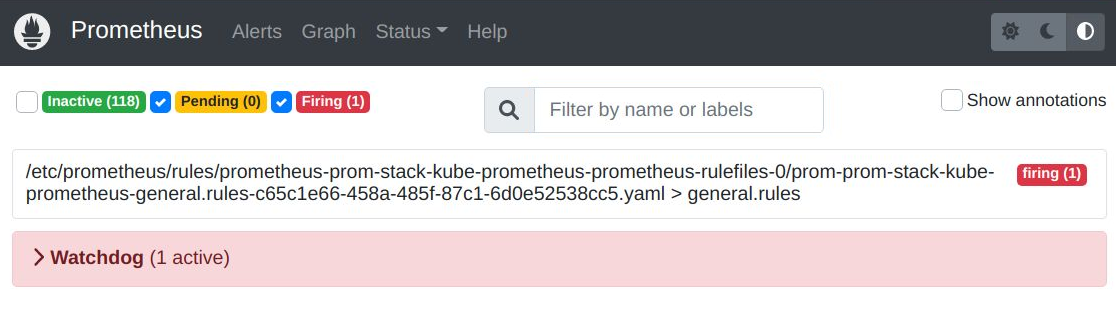
The only alert is ‘Watchdog’ which should always be firing because it signifies the alerting pipeline is functional.
Stop kubectl port forwarding
As a final step, kill the kubectl port forwarding processes for port 8080 and 8081 that we placed in the background earlier.
# stop background process
kill $PF_PID8080
kill $PF_PID8081
REFERENCES
github kube-prometheus-stack, monitoring stack that includes Prometheus Operator
github Prometheus Operator, diagram of ServiceMonitor relationship
phoenixnap.com, kubectl port-forward
alex.dzyoba, Prometheus alert expression examples
docs.syseleven.de, adding a single prometheus rule
prometheus with custom service monitor for Traefik
picluster.ricsanfre.com, adding custom ServiceMonitor for Traefik,Longhorn,Velero,minio