![]() If your Grafana deployment is using a sidecar to watch for new dashboards defined as a ConfigMap, then adding a dashboard is a dynamic operation that can be done without even restarting the pod.
If your Grafana deployment is using a sidecar to watch for new dashboards defined as a ConfigMap, then adding a dashboard is a dynamic operation that can be done without even restarting the pod.
If you have deployed the Prometheus/Grafana stack with kube-prometheus-stack, then you can check for the existence of the ‘grafana-sc-dashboard’ sidecar using:
# view containers making up Grafana pod
myprom_ns=prom
$ kubectl get pod -l app.kubernetes.io/name=grafana -n $myprom_ns -o=jsonpath='{range .items[*].spec.containers[*]}{.name},{.image}{"\n"}{end}'

grafana-sc-dashboard,quay.io/kiwigrid/k8s-sidecar:1.19.2
grafana-sc-datasources,quay.io/kiwigrid/k8s-sidecar:1.19.2
grafana,grafana/grafana:9.0.1
In this article, I will show you how to identify a metric to measure in Prometheus, create a dashboard in Grafana to display this metric, and then export this dashboard as json.
This json can then be used to recreate this dashboard across your other Grafana instances by populating a ConfigMap with the json data and a proper label.
Identify metric
As a basic example, let’s consider the total pod count of the cluster. Using kubectl, get a count of pods in all namespaces that have a non-zero count.
# skip any pods that have 0 count
$ kubectl get pod -A --no-headers | awk {'print $3'} | grep -v ^0 | wc -l
19
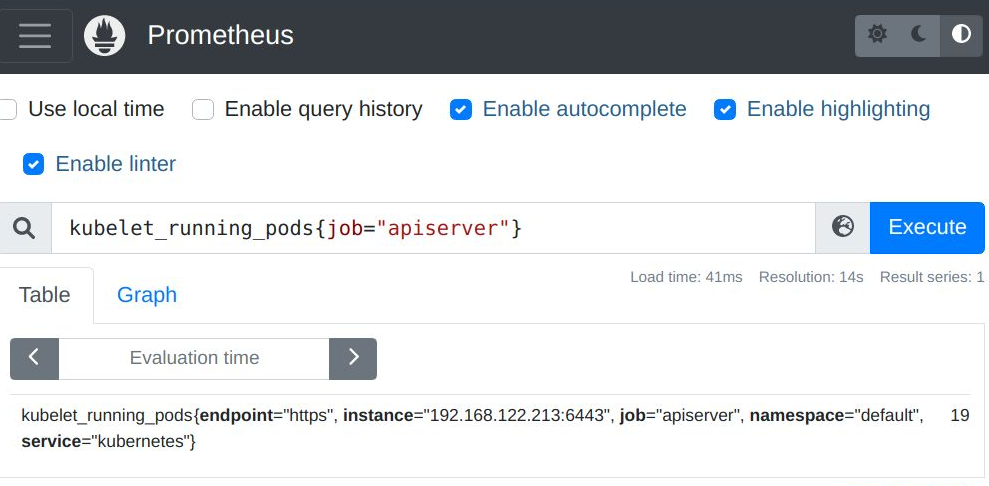
Verify this value matches from the main Prometheus page, using a query like below on ‘kubelet_running_pods’.
kubelet_running_pods{job="apiserver"}
Create Dashboard manually
Now we construct the dashboard manually in the Grafana web UI. We want to construct the dashboard manually once, and then export it as json, where it can then be placed into a ConfigMap for future automation and persistence.
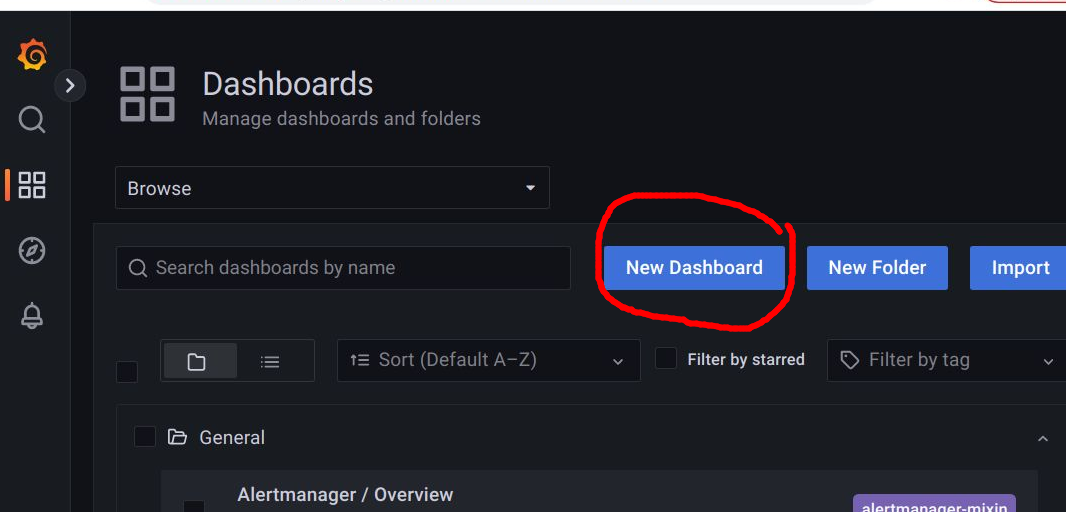
Login to Grafana, click on Dashboards > New Dashboard.
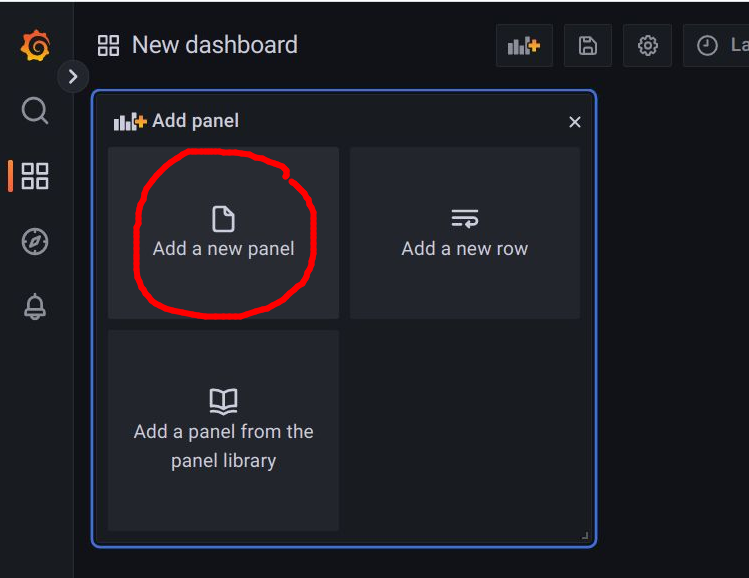
Select “Add a new panel”.
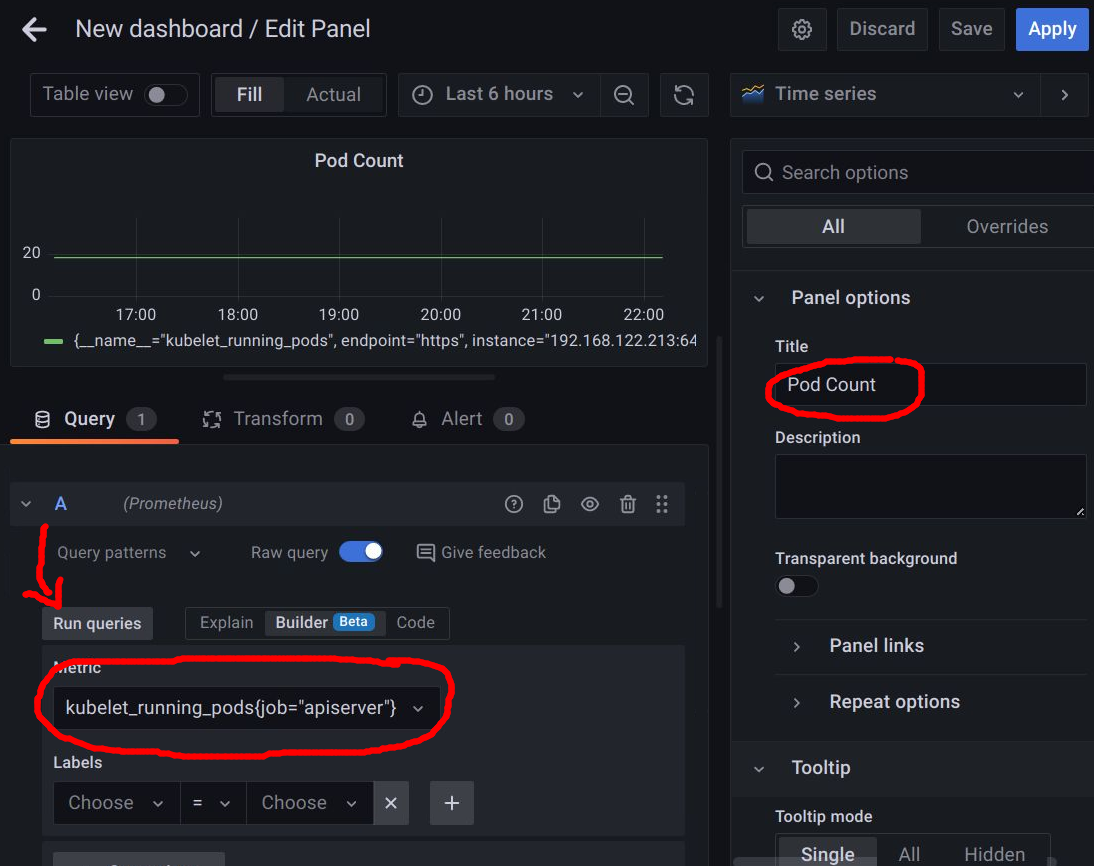
Use “Pod Count” for the graph title, select Prometheus as the data source and enter the Prometheus metric we tested earlier, then press the “Run queries” button to have the graph populated.
Then press “Save” and enter the dashboard name “kubernetes pod count”, and press “Save”.
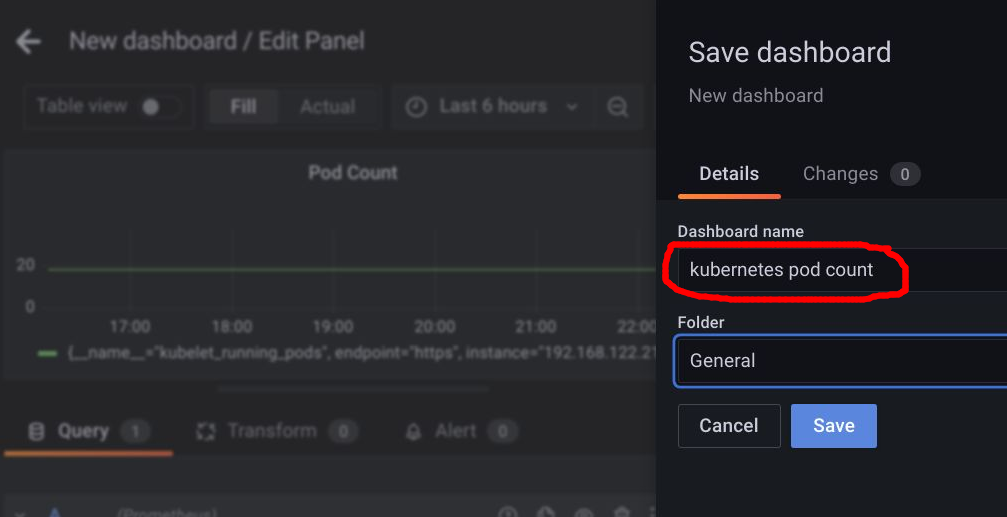
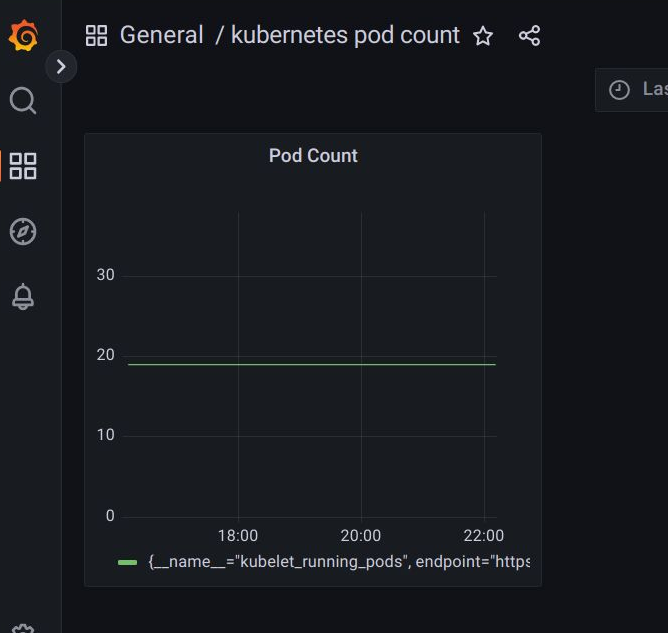
You will then see the dashboard rendered.
Export json dashboard
Save this dashboard as a json file by pressing the “Share” icon as shown below.
![]()
Navigate to the “Export” tab and press “Save to file”.
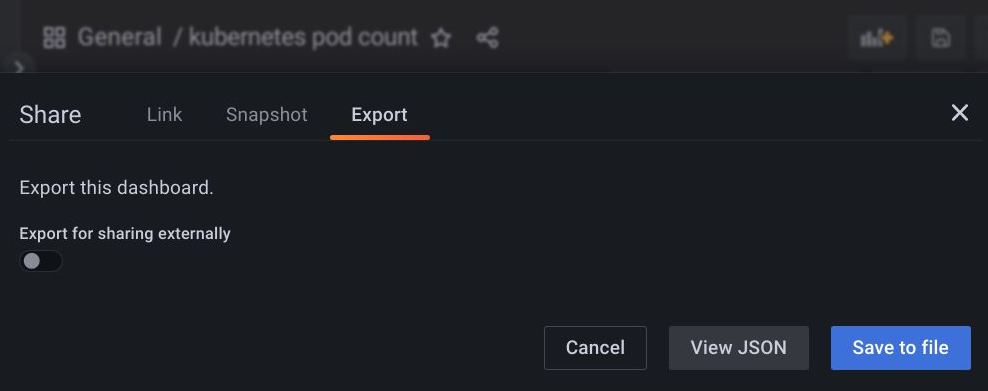
This will save a json file down to your local browser host, which for most OS/browsers is your “Downloads” directory.
Delete manually created dashboard
To prove that the json file we just downloaded can recreate this dashboard, we need to delete it.
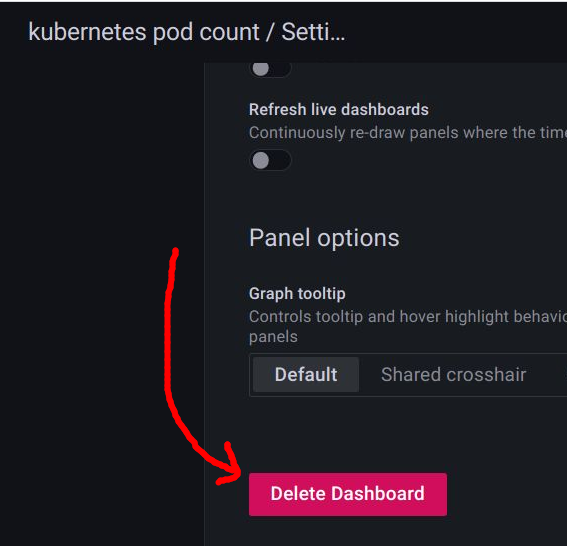
From the dashboard view, press the “Settings” icon as shown below.
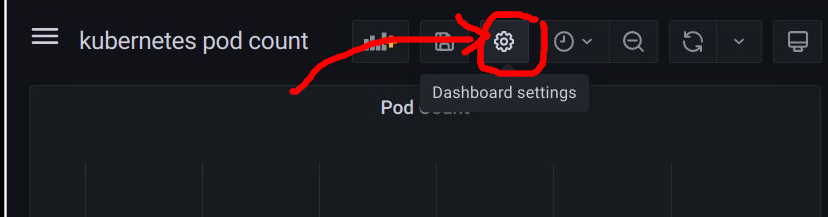
A settings screen with the ‘General’ tab selected will be shown, scroll down to the bottom and press the “Delete Dashboard” button.
Confirm this choice and you will be taken back to the main dashboard page, and confirm your manually created dashboard is gone.
Recreate Grafana dashboard using ConfigMap
But we still have the locally downloaded json file, and if we use it to create a specially labeled ConfigMap then the Grafana kiwigrid sidecar will automatically pick it up and recreate the dashboard.
ConfigMap syntax
This sidecar looks for ConfigMap in the same namespace as the Grafana pod (‘prom’ in our example), with the label “grafana_dashboard” set to “1”. Below is an example of the proper syntax, here is a full example for downloading.
# pod-count-dashboard.yaml
apiVersion: v1
kind: ConfigMap
metadata:
  labels:
    grafana_dashboard: "1"
  name: grafana-k8s-pod-count
  namespace: prom
data:
  k8s-pod-count.json: |-
    {
      ...
      ...
      ...
    }
Create ConfigMap
You can create this ConfigMap manifest however you want. It can be done manually, where you copy-paste the downloaded json into a manifest, and make sure it is indented per yaml block syntax. Or you can use kubectl to create a configmap using the exported json file. and then add the required label.
# use your namespace
myprom_ns=prom

# create cofigmap from exported json
kubectl create configmap grafana-k8s-pod-count -n $myprom_ns --from-file=k8s-pod-count.json

# apply label that makes it Grafana target
kubectl label configmap grafana-k8s-pod-count -n $myprom_ns grafana_dashboard=1
Here is the full pod-count-dashboard.yaml on github.
# verify creation of configmap in Grafana namespace
$ kubectl get configmap -n $myprom_ns grafana-k8s-pod-count
NAME DATA AGE
grafana-k8s-pod-count 1 2m
Validate Dashboard in Grafana
Wait about 30 seconds, and then search for “pod count” in the dashboard main view and you should find the “kubernetes pod count” dashboard.
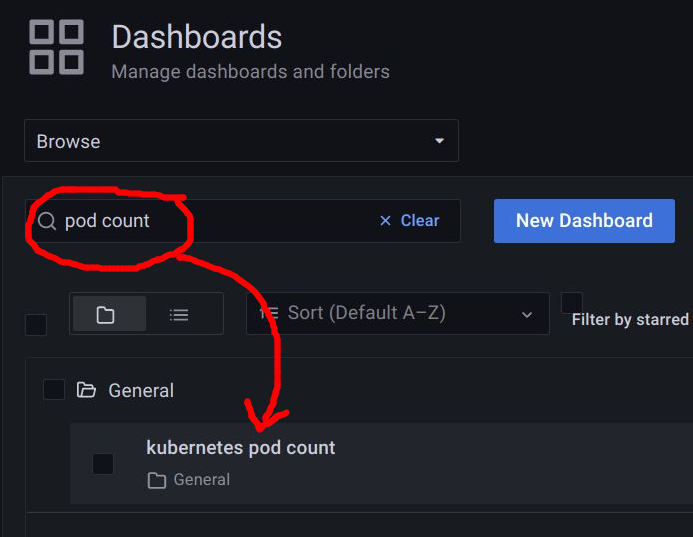
Click on it, and you will once again see the dashboard you originally created manually.
REFERENCES
syseleven.de, adding Grafana dashboard via ConfigMap
Ishan Jain, kiwigrid/k8s-sidecar enabled for dashboard configmaps
github, kiwigrid sidecar project for making configmap available as local file in pod
github kubernetes issue, kubectl create configmap does not have option for adding label at same time
NOTES
Creating ConfigMap using kustomize
You could also create the ConfigMap use kustomize, the built-in overlay engine for kubectl, to define the ConfigMap with the embedded json data.
# kustomization.yaml

apiVersion: kustomize.config.k8s.io/v1beta1
kind: Kustomization

commonLabels:
 grafana_dashboard: "1"

configMapGenerator:
- name: grafana-k8s-pod-count
  namespace: prom
  # specify name of locally downloaded json
  files:
  - k8s-pod-count.json

generatorOptions:
  disableNameSuffixHash: true
Apply the settings from “kustomization.yaml” using the kustomize command or ‘-k’ flag as shown below.
# generate configmap then apply
$ kubectl kustomize | kubectl apply -f -
configmap/grafana-k8s-pod-count created

# generate configmap and apply
# kubectl apply -k .