![]() If you need to validate your AlertManager routing configuration by sending a test alert through AlertManager, you can port-forward the AlertManager pod and send it from curl on your development host.
If you need to validate your AlertManager routing configuration by sending a test alert through AlertManager, you can port-forward the AlertManager pod and send it from curl on your development host.
Real alerts typically have scrape delays and then durations that must be met, so this is a way of getting almost immediate feedback on your routing and receivers.
# use namespace where prometheus is installed
my_ns=prom

# port forward AlertManager pod to localhost:9093
kubectl port-forward statefulset/alertmanager-prom-stack-kube-prometheus-alertmanager -n $my_ns 9093

# send test alert to localhost:9093
$ curl -H 'Content-Type: application/json' -d '[{"labels":{"alertname":"myalert"}}]' http://127.0.0.1:9093/api/v1/alerts
{"status":"success"}
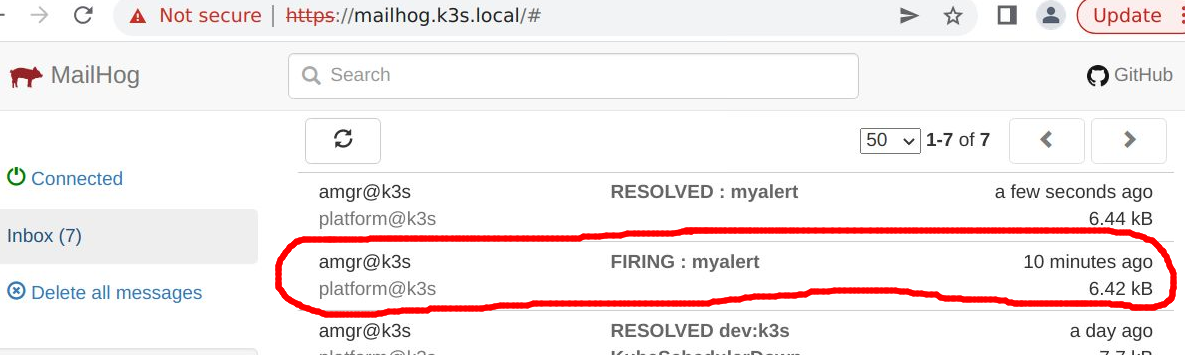
You will be sent an alert to the relevant receivers almost immediately. Here is an example of the alert above sent to an email_config that is pointed to an in-cluster SMTP MailHog server.
REFERENCES
syseleven.de, sending test alert
docs, AlertManager configuration
NOTES
using internal cluster IP of alertmanager pod
alert_pod_IP=$(kubectl get services -n $my_ns prom-stack-kube-prometheus-alertmanager -o=jsonpath='{.spec.clusterIP}')
curl -H 'Content-Type: application/json' -d '[{"labels":{"alertname":"myalert"}}]' http://$alert_pod_IP:9093/api/v1/alerts
OR using internal cluster IP of service
alert_svc_IP=$(nslookup prom-stack-kube-prometheus-alertmanager.prom | grep ^Address | awk '{print $2'} | sed -n 2p)
curl -H 'Content-Type: application/json' -d '[{"labels":{"alertname":"myalert"}}]' http://$alert_svc_IP:9093/api/v1/alerts