![]() If you are running the Prometheus Operator (e.g. with kube-prometheus-stack) then you can specify additional scrape config jobs to monitor your custom services.
If you are running the Prometheus Operator (e.g. with kube-prometheus-stack) then you can specify additional scrape config jobs to monitor your custom services.
An additional scrape config uses regex evaluation to find matching services en masse, and targets a set of services based on label, annotation, namespace, or name.
Note that adding an additional scrape config is a powerful lower-level operation, and must be specified in the Prometheus config file or prometheusSpec section of the Helm chart values. So its most appropriate use is when you want to implement a platform level mechanism for monitoring, and you control the Prometheus installation and configuration settings.
For those of you sitting higher in the application stack, see my previous article on creating a custom ServiceMonitor.
Overview
We are going to instruct Prometheus to scrape Services that have an annotation ‘prometheus.io/scrape=true’, and have a named port that ends with the word ‘metrics’.
Ultimately, this is done by adding a job to the ‘scrape_configs‘ of the Prometheus config file. This will be specified in a Helm custom values file since we are using kube-prometheus-stack to install the Prometheus Operator.
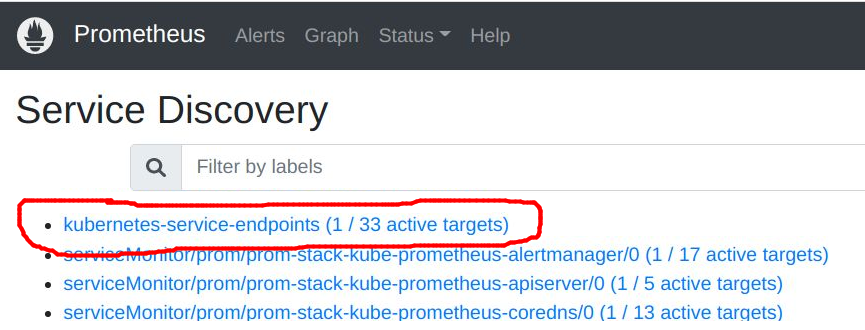
Once done, we will be able to see our additional kubernetes_sd_config named ‘kubernetes-service-endpoints’ in the Prometheus web UI under “Service Discovery”.
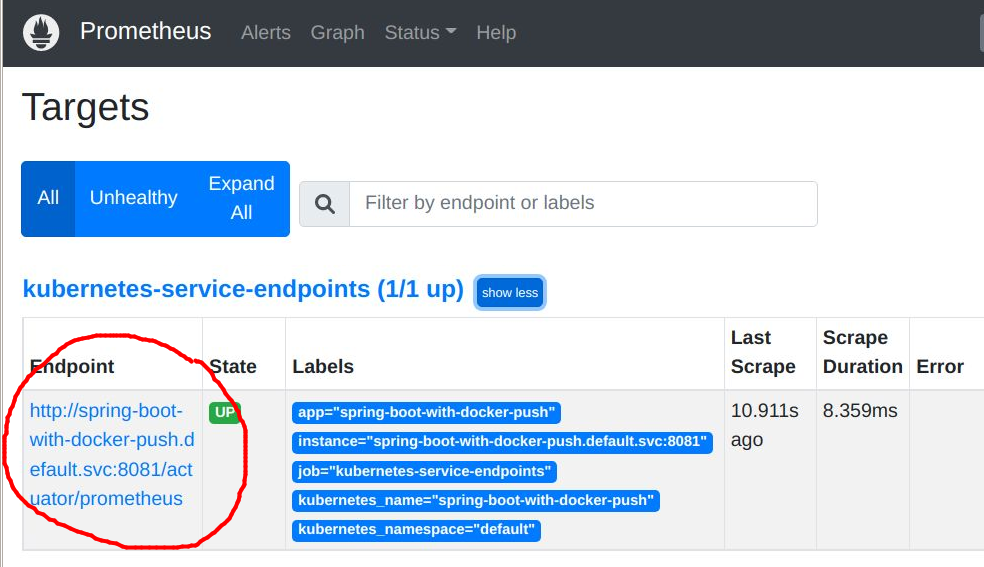
And the custom service with the “prometheus.io/scrape” annotation will show up under the “Targets” section of the Prometheus web UI under the ‘kubernetes-service-endpoints’.
Within a minute, you should be able to query a custom metric from this service from the Prometheus web UI main page.
Now let’s dive into the details of configuring these pieces.
Adding scrape config to Prometheus config file
Ultimately, the additional scrape config must go into the Prometheus ‘config.file’.
In this article, we will be using the kube-prometheus-stack, which is deployed via Helm chart. So the additional scrape config needs to be placed into the Helm custom values file at ‘prometheus.prometheusSpec.additionalScrapeConfigs‘ in a syntax like below.
# prom-custom-values.yaml
prometheus:
  prometheusSpec:
    additionalScrapeConfigs:
      - job_name: kubernetes-service-endpoints
        kubernetes_sd_configs:
        - role: service
        relabel_configs:

        # annotation 'prometheus.io/scrape' must be set to 'true'
        - action: keep
          regex: true
          source_labels: [__meta_kubernetes_service_annotation_prometheus_io_scrape]

        # service cannot be in kube-system or prom namespaces
        - action: drop
          regex: (kube-system|prom)
          source_labels: [__meta_kubernetes_namespace]

        # service port name must end with word 'metrics'
        - action: keep
          regex: .*metrics
          source_labels: [__meta_kubernetes_service_port_name]

        # allow override of http scheme
        - action: replace
          regex: (https?)
          source_labels: [__meta_kubernetes_service_annotation_prometheus_io_scheme]
          target_label: __scheme__

        # allow override of default /metrics path
        - action: replace
          regex: (.+)
          source_labels: [__meta_kubernetes_service_annotation_prometheus_io_path]
          target_label: __metrics_path__

        # allow override of default port
        - action: replace
          regex: ([^:]+)(?::\d+)?;(\d+)
          replacement: $1:$2
          source_labels: [__address__, __meta_kubernetes_service_annotation_prometheus_io_port]
          target_label: __address__
        - {action: labelmap, regex: __meta_kubernetes_service_label_(.+)}
        - action: replace
          source_labels: [__meta_kubernetes_namespace]
          target_label: kubernetes_namespace
        - action: replace
          source_labels: [__meta_kubernetes_service_name]
          target_label: kubernetes_name
A full custom Helm values file with the additional scrape config can be found on my github here.
You will then need to reapply the new settings to the kube-prometheus-stack release using ‘helm upgrade’.
# will give you namespace, release name of kube-prometheus-stack
helm list -A | grep prometheus

# tailor this to your namespace and release name
helm upgrade \
  --namespace prom \
  -f prom-custom-values.yaml \
  prom-stack prometheus-community/kube-prometheus-stack
The Helm installation adds your scrape entry to the Prometheus StatefulSet config file placed inside the pod.
# show path to Prometheus 'config.file'
kubectl get statefulset -l app=kube-prometheus-stack-prometheus -A \
  -o=jsonpath='{.items[*].spec.template.spec.containers[*].args}' | jq | grep 'config.file'

# put namespace and name of Prometheus into variables
ns=$(kubectl get statefulset -l app=kube-prometheus-stack-prometheus -A --no-headers | awk {'print $1'})
name=$(kubectl get statefulset -l app=kube-prometheus-stack-prometheus -A --no-headers | awk {'print $2'})

# show content of Prometheus 'config.file'
kubectl exec -it statefulset/$name -n $ns -c prometheus -- cat /etc/prometheus/config_out/prometheus.env.yaml
Deploying custom app and Service
Now let’s deploy a custom app and Service that has the ‘prometheus.io/scrape’ annotation and named service port ending with ‘metrics’ that qualifies it for monitoring by this additional scrape config job.
We will use a small Spring Boot REST service developed in another article. Clone my github project as shown below to pull the required Kubernetes manifests.
# get my sample project from github
git clone https://github.com/fabianlee/spring-boot-with-docker-push.git
cd spring-boot-with-docker-push/src/main/resources/kubernetes

# deploy 'spring-boot-with-docker-push' app into kubernetes
sed 's/<%=version%>/0.0.2-SNAPSHOT/' deployment-and-service.yaml | kubectl apply -f -

# wait for, then validate Deployment
$ kubectl wait deployment spring-boot-with-docker-push --for condition=Available=True --timeout=90s
$ kubectl get deployment spring-boot-with-docker-push
NAME READY UP-TO-DATE AVAILABLE AGE
spring-boot-with-docker-push 1/1 1 1 156m

# validate that Service exists now
$ kubectl get service spring-boot-with-docker-push
NAME TYPE CLUSTER-IP EXTERNAL-IP PORT(S) AGE
spring-boot-with-docker-push ClusterIP 10.43.226.114 <none> 8080/TCP,8081/TCP 157m

# show named ports of service, notice one that ends with 'metrics'
$ kubectl get service spring-boot-with-docker-push -o=jsonpath='{range .spec.ports[*]}{.name} {.port}{"\n"}{end}'
http 8080
http-actuator-metrics 8081

# value of scrape annotation is initially false, set true to enable monitoring
kubectl annotate service spring-boot-with-docker-push "prometheus.io/scrape=true" --overwrite
Validate Prometheus Service Discovery and Targets
With the additional scrape config added to Prometheus, and now a custom Service that fits the annotation and named port criteria, we should now see our additional kubernetes_sd_config named ‘kubernetes-service-endpoints’ in the Prometheus web UI under “Service Discovery”.
The “1/33 active targets” is saying there are 33 services in the cluster it considered for targeting, but only a single one (our ‘spring-boot-with-docker-push’ service) fits the annotation (prometheus.io/scrape=true), named port (http-actuator-metrics), and namespace (default) criteria we set in our scrape config actions. This is what we want.
In the “Targets” section of the Prometheus web UI, under the ‘kubernetes-service-endpoints’, you will see the endpoint of our ‘spring-boot-with-docker-push’ service, using port 8081 (named port ‘http-actuator-metrics’) and using the context path (/actuator/prometheus).
The default endpoint for a service would be “/metrics”, but we overrode this with a “prometheus.io/path” annotation on the service.
# show prometheus related annotations on monitored service
$ kubectl get service spring-boot-with-docker-push -o=jsonpath='{.metadata.annotations}' | jq . | grep -v last-applied
{
  "prometheus.io/path": "/actuator/prometheus",
  "prometheus.io/scrape": "true"
}
Query custom metric in Prometheus
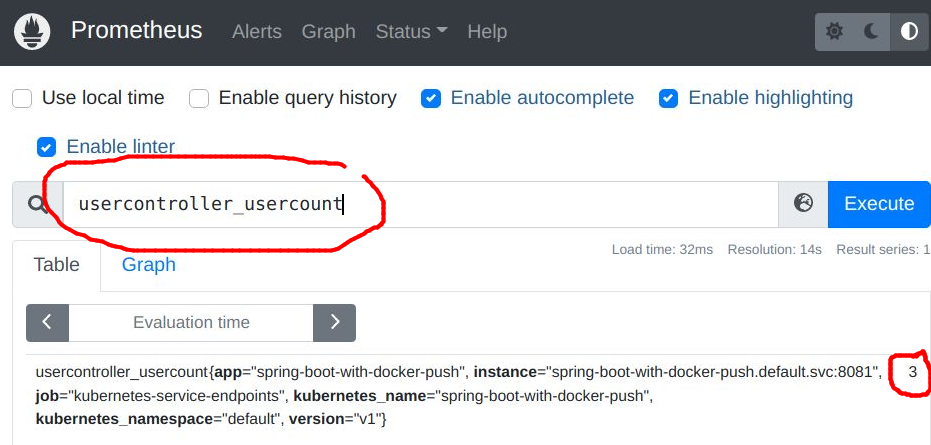
Within a minute, you should be able to query a custom metric from this service from the Prometheus web UI main page.
‘usercontroller_usercount’ is a metric exposed at the service “:8081/actuator/prometheus’ endpoint that denotes how many users are being managed.
If you did a curl to this internal management endpoint, it would yield many rows of metrics in Prometheus standard format, with one of them looking like below.
...
usercontroller_usercount{version="v1",} 3.0
...
Summary
In this article I’ve provided the foundations for how you can add a low-level scrape job for the Prometheus Operator, if you control the Prometheus installation and believe that setting this up at the platform/cluster level is appropriate.
For those sitting higher in the application stack, it is often better to create a custom ServiceMonitor as described in my previous article.
REFERENCES
Prometheus, kubernetes_sd_configs
fabianlee.org, article on creating custom ServiceMonitor
Vitaly blog.pilosus.org, add new scraping targets with stable/prometheus-operator
github, additional scrape config and secret
stuff.21zoo.com, configure prometheus to scrape pods