![]() The kube-prometheus-stack bundles the Prometheus Operator, monitors/rules, Grafana dashboards, and AlertManager needed to monitor a Kubernetes cluster.
The kube-prometheus-stack bundles the Prometheus Operator, monitors/rules, Grafana dashboards, and AlertManager needed to monitor a Kubernetes cluster.
But there are customizations necessary to tailor the Helm installation for a Kubernetes cluster built using kubeadm.
In this article, I will detail the necessary modifications to deploy a healthy monitoring stack on a kubeadm cluster.
Prerequisites
kubeadm cluster
You must have a healthy kubeadm cluster.
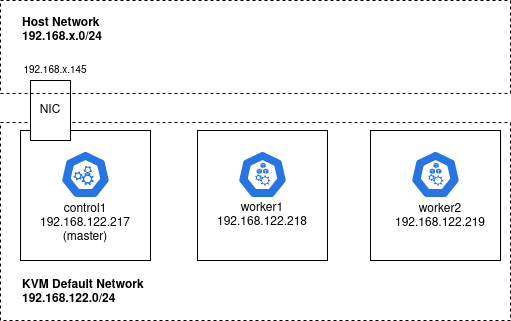
If you do not, then you can follow the instructions in my kubeadm cluster on KVM using Ansible article, which will create a cluster like below, with 192.168.122.217 as the master running the management components.
Helm
If you do not have Helm3 installed, follow my article on Helm installation here.
External Kubernetes Storage Class
To support persistence and scheduling of the monitoring components across any node in the cluster, you need to provide an external Kubernetes storageclass. One that is accessible from any node in the cluster and has independent persistence.
You could use a full-fledged cluster storage solution like longhorn, but I will prefer the nfs-subdir-external-provisioner from my article here. This creates a new ‘nfs-client’ storageclass that uses an NFS export from your Host machine.
kubeadm cluster preparation
By default, kubeadm binds several of its management components to the localhost 127.0.0.1 address of the VM, specifically: Kube Controller Manager, Kube Proxy, and Kube Scheduler.
However, for monitoring we need these endpoints exposed so their metrics can be pulled by Prometheus. Therefore we need to expose these components on their 0.0.0.0 address.
While logged into the kubeadm master node, run the following modifications.
Change bind address to kube-controller
sudo sed -i 's/--bind-address=127.0.0.1/--bind-address=0.0.0.0/' /etc/kubernetes/manifests/kube-controller-manager.yaml
Change bind address to kube-scheduler
sudo sed -i 's/--bind-address=127.0.0.1/--bind-address=0.0.0.0/' /etc/kubernetes/manifests/kube-scheduler.yaml
Append listen metrics URL for etcd
# master where etcd is running
master_ip=192.168.122.217
sed -i "s#--listen-metrics-urls=.*#--listen-metrics-urls=http://127.0.0.1:2381,http://$master_ip:2381#" /etc/kubernetes/manifests/etcd.yaml
Add bind address to kube-proxy using kubectl
# replace default empty string with 0.0.0.0 binding
kubectl get configmap/kube-proxy -n kube-system -o json | sed 's#metricsBindAddress: \\"\\"#metricsBindAddress: 0.0.0.0:10249#'

# restart of kube-proxy
kubectl -n kube-system rollout restart daemonset/kube-proxy
Validate kubeadm listeners
You can verify the changes above by checking the bound ports.
# kubeControllerManager is on port 10257
# kubeScheduler is on port 10259
# kubeProxy is on port 10249
# etcd is on port 2381

$ sudo netstat -tulnp | grep -e 10257 -e 10259 -e 10249 -e 2381
tcp        0      0 192.168.122.217:2381    0.0.0.0:*               LISTEN      1400/etcd
tcp        0      0 127.0.0.1:2381          0.0.0.0:*               LISTEN      1400/etcd
tcp6       0      0 :::10257                :::*                    LISTEN      1434/kube-controlle
tcp6       0      0 :::10259                :::*                    LISTEN      1486/kube-scheduler
tcp6       0      0 :::10249                :::*                    LISTEN      4377/kube-proxy

# sanity test that etcd metrics are available
curl -k http://localhost:2381/metrics

# sanity test that kube proxy metrics are available
curl -k http://localhost:10249/metrics
Helm custom values file
Before we install the kube-prometheus-stack with Helm, we need to create a custom values file to adjust the default chart values to the kubeadm cluster.
etcd port override
The kubeadm etcd monitoring is available on port 2381 (not the default 2379 specified in the Helm chart), so we need to explicitly override this value.
kubeEtcd:
  enabled: true
  service:
    enabled: true
    port: 2381
    targetPort: 2381
Disable etcdHighNumberOfFailedGRPCRequests rule
There is a bug in the kube-prometheus-stack Helm chart rules for etcd. The etcHighNumberOfFailedGRPCRequests rule only specifies ‘grpc_code!=OK’, when it should take into account multiple code status.
This is fixed in the upstream chart, but not in kube-prometheus-stack, so we must disable the rule to avoid false alerts.
defaultRules:
  disabled:
    etcdHighNumberOfFailedGRPCRequests: true
External storage
Since this article is about kubeadm clusters, be sure to use external storage for AlertManager and Prometheus. If you do not, an emptyDir will be used which only lasts for the pod lifetime.
The storage can be set at alertmanager.alertmanagerSpec.storage as shown here, and prometheus.prometheusSpec.storageSpec as shown here.
Full custom values files
I have a full example values file for a kubeadm cluster at prom-sparse.expanded.yaml.
I have included settings for ingress and exposing AlertManager, Grafana, and Prometheus at a subdomain but these are not specific to kubeadm.
Run Helm installation
Add the Helm repository.
helm repo add prometheus-community https://prometheus-community.github.io/helm-charts

# validate helm repo was added
helm repo list

# make sure we have the latest chart
helm repo update prometheus-community
Install the chart using Helm.
# create the namespace
kubectl create ns prom

# install
helm install \
  --namespace prom \
  -f prom-sparse.yaml \
  prom-stack prometheus-community/kube-prometheus-stack
If you modify the custom values file and need to update the release, change ‘install’ to ‘upgrade’.
helm upgrade \
  --namespace prom \
  -f prom-sparse.yaml \
  prom-stack prometheus-community/kube-prometheus-stack
Validate status of installation.
# releases in all namespaces
helm list -A
# releases just in 'prom' namespace
helm list -n prom

# check status of prometheus stack release
helm status prom-stack -n prom
REFERENCES
longhorn.io, alternative storageclass for cluster
github, fully populated values.yaml for kube-prometheus-stack
kruschecompany, prometheus operator with helm and traefik monitor
digitalocean, prometheus operator setup
fosstechnix, prometheus and grafana without operator
github, docs for prometheus operator, describes ‘externalLabels’
joekreager, prometheus operator and blackbox
github, kube-state-metrics values.yaml, subchart of kube-prometheus-stack
sysdig, monitoring of etcd with scrape config
Murat Kelem, describes name change from prometheus-operator to kube-prometheus-stack
github, fixed etcd rule for GRPC
github, not fixed in kube-prometheus-stack helm chart
NOTES
show values available to chart
helm show values prometheus-community/kube-prometheus-stack