![]() The kube-prometheus-stack bundles the Prometheus Operator, monitors/rules, Grafana dashboards, and AlertManager needed to monitor a Kubernetes cluster.
The kube-prometheus-stack bundles the Prometheus Operator, monitors/rules, Grafana dashboards, and AlertManager needed to monitor a Kubernetes cluster.
But there are customizations necessary to tailor the Helm installation for K3s, a lightweight Kubernetes installation.
In this article, I will detail the necessary modifications to deploy a healthy monitoring stack on a K3s cluster.
Prerequisites
K3s cluster
You must have a healthy rancher K3s cluster.
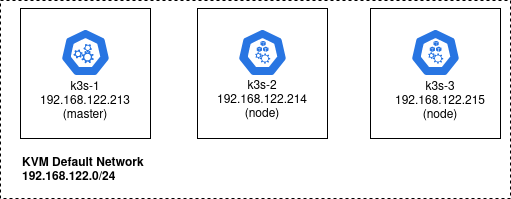
If you follow the instructions in my K3S cluster on Ubuntu using Terraform article, then you will have a cluster like below, with 192.168.122.213 as the master running the management components.
Helm
If you do not have Helm3 installed, follow my article on Helm installation here.
External Kubernetes Storage Class
To support persistence and scheduling of the monitoring components across any node in the cluster, you need to provide an external Kubernetes storageclass. One that is accessible from any node in the cluster and has independent persistence.
You could use a full-fledged cluster storage solution like longhorn, but I will prefer the nfs-subdir-external-provisioner from my article here. This creates a new ‘nfs-client’ storageclass that uses an NFS export from your Host machine.
K3s cluster preparation
By default, K3s binds several of its management components to the localhost 127.0.0.1 address of the VM, specifically: Kube Controller Manager, Kube Proxy, and Kube Scheduler.
However, for monitoring we need these endpoints exposed so their metrics can be pulled by Prometheus. Therefore we need to expose these components on their 0.0.0.0 address.
You can change these settings on the K3s master by placing a file with the content below at “/etc/rancher/k3s/config.yaml”.
kube-controller-manager-arg:
- "address=0.0.0.0"
- "bind-address=0.0.0.0"
kube-proxy-arg:
- "metrics-bind-address=0.0.0.0"
kube-scheduler-arg:
- "address=0.0.0.0"
- "bind-address=0.0.0.0"
# Controller Manager exposes etcd sqllite metrics
etcd-expose-metrics: true
Then restart the k3s service.
sudo systemctl status k3s
There will now be listeners available for each of these services, which makes it scrapable by Prometheus.
# kubeControllerManager is on port 10252
# kubeScheduler is on port 10251
# kubeProxy is on port 10249

$ sudo netstat -tulnp | grep -e 10252 -e 10251 -e 10249
tcp6 0 0 :::10251 :::* LISTEN 13122/k3s server
tcp6 0 0 :::10252 :::* LISTEN 13122/k3s server
tcp6 0 0 :::10249 :::* LISTEN 13122/k3s server

# sanity test that metrics are available
curl -k http://localhost:10252/metrics
Helm custom values file
Before we install the kube-prometheus-stack with Helm, we need to create a custom values file to adjust the default chart values to the K3s cluster.
disable etcd
K3s has a sqllite backed etcd implementation. This means we cannot monitor it as expected by default, so we need to disable these components.
defaultRules:
  rules:
    etcd: false

kubeEtcd:
  enabled: false
Override management component endpoints and ports
The config.yaml we placed on the master K3s node (192.168.122.213) exposed the Controller manager metrics on port 10252, and we need to specify that endpoint address and ports so Prometheus knows where to scrape.
Similarly, we must specify the endpoint IP and port for the Scheduler and Proxy. Without these explicit settings, the monitoring stack would not be able to find these metrics.
Using the loopback 127.0.01 results in a Helm installation error and cannot be used. Hostnames are also rejected, you are only allowed to use IP for the endpoint. Notice that ‘endpoints’ is an array, so if you had 3 HA masters, you would specify all 3 IP addresses.
# matched to service port 'prom-stack-kube-prometheus-kube-controller-manager' -n kube-system
kubeControllerManager:
  enabled: true
  endpoints: ['192.168.122.213']
  service:
    enabled: true
    port: 10252
    targetPort: 10252
  serviceMonitor:
    enabled: true
    https: false

# matched to service port 'prom-stack-kube-prometheus-kube-scheduler' -n kube-system
kubeScheduler:
  enabled: true
  endpoints: ['192.168.122.213']
  service:
    enabled: true
    port: 10251
    targetPort: 10251
  serviceMonitor:
    enabled: true
    https: false

# matched to service port 'prom-stack-kube-prometheus-kube-proxy' -n kube-system
kubeProxy:
  enabled: true
  endpoints: ['192.168.122.213']
  service:
    enabled: true
    port: 10249
    targetPort: 10249
External storage
Since this article is about K3s clusters, be sure to use external storage for AlertManager and Prometheus. If you do not, an emptyDir will be used which only lasts for the pod lifetime.
Even using the K3s local-path storage class only provides node level durability, and when you have a multi-node cluster this will not be sufficient.
The storage can be set at alertmanager.alertmanagerSpec.storage as shown here, and prometheus.prometheusSpec.storageSpec as shown here.
Full custom values files
I have a full example values file for a K3s cluster at prom-sparse.expanded.yaml.
I have included settings for ingress and exposing AlertManager, Grafana, and Prometheus at a subdomain but these are not specific to K3s.
Run Helm installation
Add the Helm repository.
helm repo add prometheus-community https://prometheus-community.github.io/helm-charts

# validate helm repo was added
helm repo list

# make sure we have the latest chart
helm repo update prometheus-community
Install the chart using Helm.
# create the namespace
kubectl create ns prom

# install
helm install \
  --namespace prom \
  -f prom-sparse.yaml \
  prom-stack prometheus-community/kube-prometheus-stack
If you modify the custom values file and need to update the release, change ‘install’ to ‘upgrade’.
helm upgrade \
  --namespace prom \
  -f prom-sparse.yaml \
  prom-stack prometheus-community/kube-prometheus-stack
Validate status of installation.
# releases in all namespaces
helm list -A
# releases just in 'prom' namespace
helm list -n prom

# check status of prometheus stack release
helm status prom-stack -n prom
REFERENCES
rancher.com, settings for master
rancher.com, settings for workers
longhorn.io, alternative storageclass for cluster
github, fully populated values.yaml for kube-prometheus-stack
kruschecompany, prometheus operator with helm
digitalocean, prometheus operator setup
fosstechnix, prometheus and grafana without operator
github, docs for prometheus operator, describes ‘externalLabels’
joekreager, prometheus operator and blackbox
github, kube-state-metrics values.yaml, subchart of kube-prometheus-stack
sysdig, monitoring of etcd with scrape config
NOTES
show values available to chart
helm show values prometheus-community/kube-prometheus-stack
show port values being used by K3s embedded components
sudo journalctl -u k3s --no-pager | grep 'Running kube-scheduler ' | tail -n1 | grep -Po '\-\-bind-address=([^ ]*)|\-\-secure-port=(\d*)'
sudo journalctl -u k3s --no-pager | grep 'Running kube-controller-manager ' | tail -n1 | grep -Po '\-\-bind-address=([^ ]*)|\-\-secure-port=(\d*)'
sudo journalctl -u k3s --no-pager | grep 'Running kubelet ' | tail -n1 | grep -Po '\-\-address=(.*?) '
sudo journalctl -u k3s --no-pager | grep 'Running cloud-controller-manager ' | tail -n1 | grep -Po '\-\-bind-address=([^ ]*)'
sudo journalctl -u k3s --no-pager | grep 'Running kube-apiserver ' | tail -n1 | grep -Po '\-\-advertise-address=([^ ]*) |\-\-advertise-port=(\d*)'