![]() Zabbix is an open-source monitoring solution that provides metrics collection, dynamic indexes, alerting, dashboards, and an API for external integration. But graphing is arguably one Zabbix’s weak points; it still builds static images while other enterprise and consumer applications have set end users’ expectations for graph visualization and interactivity very high.
Zabbix is an open-source monitoring solution that provides metrics collection, dynamic indexes, alerting, dashboards, and an API for external integration. But graphing is arguably one Zabbix’s weak points; it still builds static images while other enterprise and consumer applications have set end users’ expectations for graph visualization and interactivity very high.
Luckily, the Zabbix plugin for Grafana can put a facelift on the valuable data stored in Zabbix. With this new data source, your end users can get the beautiful dashboard view they expect from a modern application.
Installation
If you need to install Grafana, then you can see the official documentation or my post that details installation on Ubuntu 14.04.
With Grafana installed, the easiest way to deploy the plugin is to use the ‘grafana-cli’ tool. However, you could also the .deb package to deploy the files that ultimately end up in the /var/lib/grafana/plugins directory.
First, get a list of the available plugins, the install the zabbix plugin:
> grafana-cli plugins list-remote
> grafana-cli plugins install alexanderzobnin-zabbix-app
Then restart the grafana service
# service grafana-server restart
Configuration
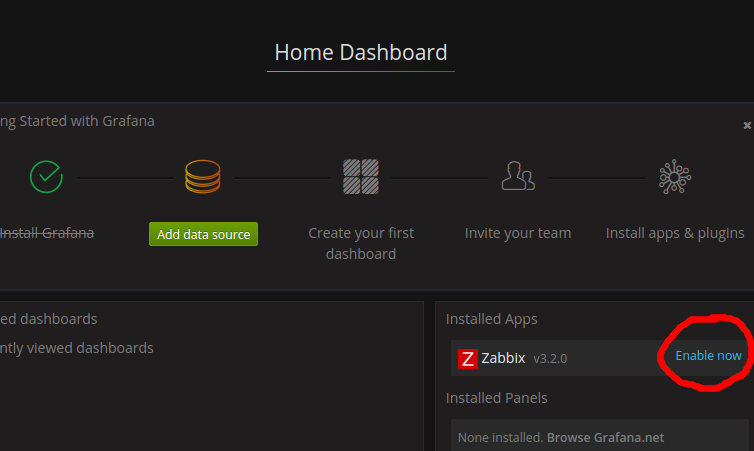
Now login to the Grafana web GUI at http://<server>:3000, and under the “Installed Apps” section, click the “Enable now” link as shown below.
This will present the Zabbix plugin screen, and you should click the “Enable” button.
With the Zabbix plugin enabled, the next step is to add Zabbix as a data source. Select “Data Sources” from the Grafana menu, and then click “Add data source”.
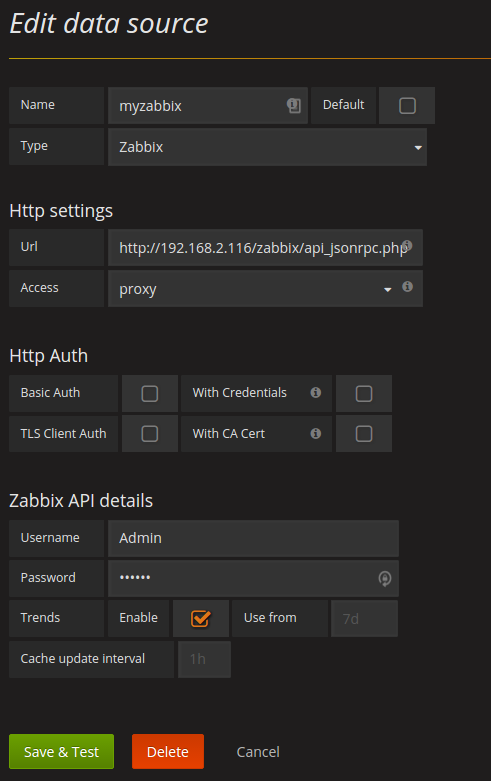
Type “myzabbix” for the name, and select “Zabbix” from the type pulldown. The URL should be the full path to the PHP page which is the API entry point, “http://<server>/zabbix/api_jsonrpc.php” and select an access mode of “proxy”. Direct would mean that the browser directly retrieves the data from Zabbix, which would force us to deal with cross origin issues.
Fill in the credentials, check the usage of trends data (see the necessary patch for Zabbix 2.x), and press “Save”. A screenshot of the necessary values is shown below.
You can then press “Save and Test” and you will get a success message telling you the version of the API if everything is configured properly.
Dashboard
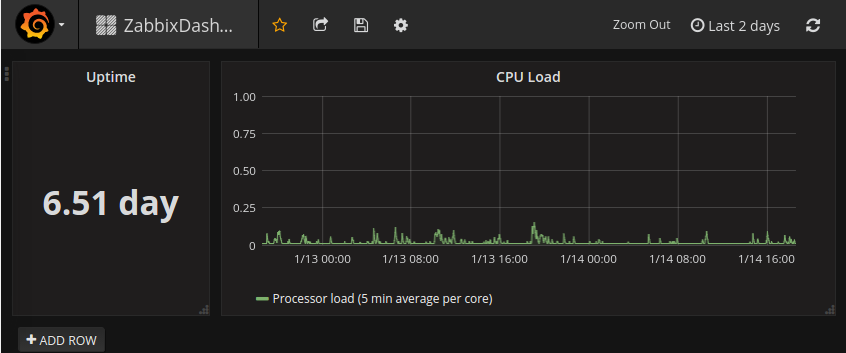
Now let’s use the Zabbix data source to create a simple Grafana dashboard that has an uptime panel for a single host, and then it’s CPU usage over time, like below:
System Uptime Panel
From the menu icon, select Dashboards > New, and select a “SingleStat” for the type. Now click on the “Panel Title” and select “Edit” which will bring up the properties of the panel.
Under the “General” tab select a title of “Uptime”.
Under the “Metrics” tab, remove the test metric using the fake data source, and select “myzabbix” for the panel data source and press “Add Query”.
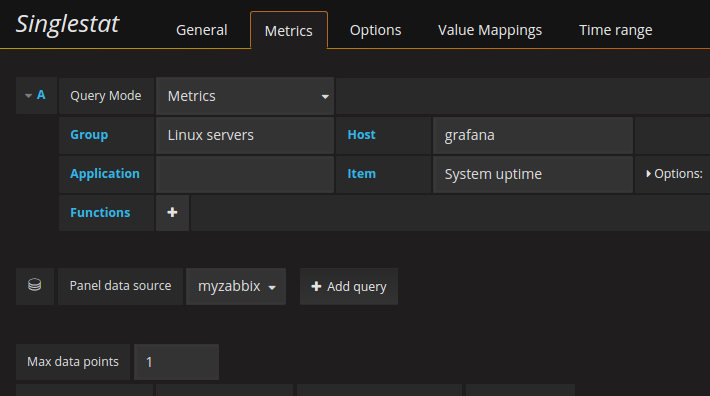
It is tempting to only specify the host name, but you must put in the Zabbix group name for the host or else the form will not work. So start typing in the hostgroup name and you should get a drop down list of possible zabbix Host groups. Then type the hostname in the next text box. Application is optional, although it helps narrow down the results of the items available. Select “System uptime” for the item. Finally set “Max data points” to 1. Your screen should look something like the screenshot below:
Now select the “Options” tab and since the value in the Zabbix database is in seconds, select for Unit “seconds (s)”. This does not mean the value will be shown to users in seconds, it just tells the system how to process the value. Now press the refresh icon in the top-right menu bar (2 arrows in a circle) and you should see the latest uptime value available from Zabbix.
CPU Load Panel
Press the “ADD ROW” button on the dashboard and now select “Graph” for the type. Now click on the “Panel Title” and select “Edit” which will bring up the properties of the panel.
Under the “General” tab select a title of “CPU Load”.
Under the “Metrics” tab, remove the test metric using the fake data source, and select “myzabbix” for the panel data source and press “Add Query”. Type the group name (which is mandatory), and then the host name. Select “CPU” for the application, and “Processor load (5 min average per core)” for the Item. The graph should now be populated with real data.
Under the “Axes” tab, select Y-Min=0 and Y-Max=1 for both Left and Right Y. CPU utilization ranges from 0.0 to 1.0, and this forces our graph into a proper scale.
Summary
There are limitations to the Zabbix plugin, for example it does not support alerting, but the functionality it provides to surface critical business level data to end users who would find Zabbix too confusing is invaluable.
REFERENCES
http://docs.grafana-zabbix.org/installation/
https://github.com/alexanderzobnin/grafana-zabbix