![]() The ElasticSearch stack (ELK) is popular open-source solution that serves as both repository and search interface for a wide range of applications including: log aggregation and analysis, analytics store, search engine, and document processing.
The ElasticSearch stack (ELK) is popular open-source solution that serves as both repository and search interface for a wide range of applications including: log aggregation and analysis, analytics store, search engine, and document processing.
Its standard web front-end, Kibana, is a great product for data exploration and dashboards. However, if you have multiple data sources including ElasticSearch, want built-in LDAP authentication, or the ability to annotate graphs, you may want to consider Grafana to surface your dashboards and visualizations.
Overview
ElasticSearch has developed a lightweight shipper of system data called Metricbeat. It run as a service and takes the cpu/mem/disk/network utilization of a remote system and sends it to ElasticSearch for storing and indexing.
In this article, we’ll take the data from that ElasticSearch index and surface it as a dashboard in Grafana.
I’ll assume you have already installed ElasticSearch and Metricbeat, and that the system metrics are being properly inserted into ElasticSearch using the default values.
Identify ElasticSearch index to expose
By default, Metricbeat stores its data in an ElasticSearch index using a daily pattern of “metricbeat-YYYY.MM.DD”. One of the many fields available in this index is “system.cpu.load.5″ which is the average CPU load over the last 5 minutes. Another field is “beat.hostname” which indicates the host where the data was collected.
These fields can be verified in Kibana by adding “metricbeat-*” as an index pattern, and exploring the data or you can use one of the many ElasticSearch plugins such as head or kopf to look at the available indexes and the fields in those indexes.
Add ElasticSearch data source
Now login to the Grafana web GUI at http://<server>:3000, and select “Data Sources” from the menu. Click on “Add data source”.
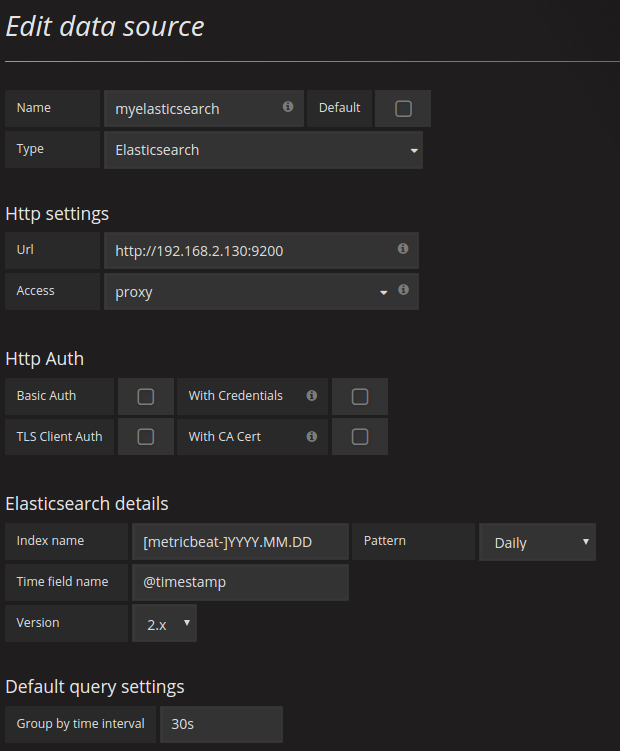
Type “myelasticsearch” for the name and select “Elasticsearch” from the type pulldown. The URL value should be the ElasticSearch server on the default port 9200. select an access mode of “proxy”. Direct would mean that the browser directly retrieves the data from Zabbix, which would force us to deal with cross origin issues.
Use a daily pattern of “[metricbeat-]YYYY.MM.DD”, and set the group by time interval to 30 seconds to avoid sawtooth patterns in the graph that result from sampling periods. A screenshot of the necessary values are shown below.
Create Dashboard
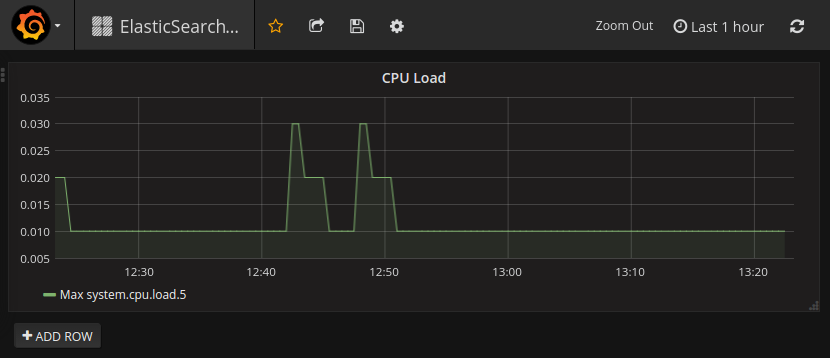
Now let’s use the ElasticSearch data source to create a simple Grafana dashboard that shows CPU load over time, like below:
From the menu icon, select Dashboards > New, and select a “Graph” for the type. Now click on the “Panel Title” and select “Edit” which will bring up the properties of the panel.
Under the “General” tab select a title of “CPU Load”.
Under the “Metrics” tab, remove the test metric using the fake data source, and select “myelasticsearch” for the panel data source and press “Add Query”.
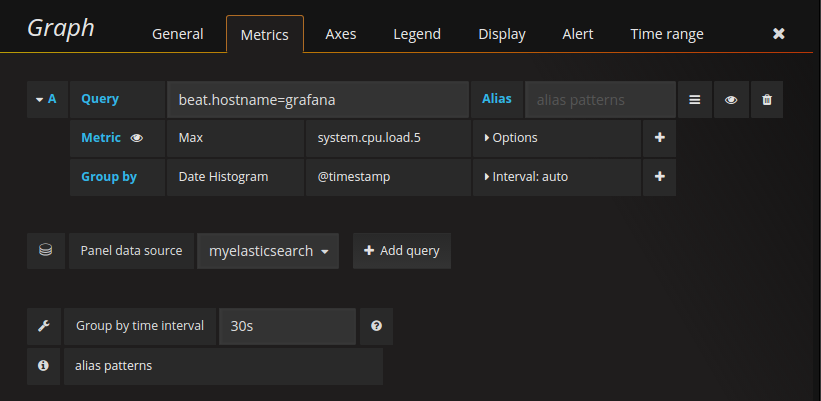
In the query textbox, specify the host you want to pull system metrics for, “beat.hostname=grafana”. This was the name of the host I had installed Metricbeat on, and clearly your hostname will need to match your environment.
Then select a maximum “Max” metric from the “system.cpu.load.5” field. It needs to be grouped by “Date Histogram” using the @timestsamp field.
The Group by time interval should be 30 seconds. Your editing panel should look something like the screenshot below:
You now have a Grafana dashboard pulling data from ElasticSearch.
RESOURCES
http://docs.grafana.org/datasources/elasticsearch/
http://logz.io/blog/grafana-vs-kibana/
http://apmdigest.com/apmacademy/visualization-tool-kibana-vs-grafana
https://sematext.com/blog/2015/12/14/using-grafana-with-elasticsearch-for-log-analytics-2/