![]() Cloud Foundry is an opinionated Platform-as-a-Service that allows you to manage applications at scale. This article is part of a series that explores different facets of a Cloud Foundry deployment using the spring-music project as an example.
Cloud Foundry is an opinionated Platform-as-a-Service that allows you to manage applications at scale. This article is part of a series that explores different facets of a Cloud Foundry deployment using the spring-music project as an example.
This article is Part 5 of a series on Cloud Foundry concepts:
- Deploying the spring-music webapp, Part 1
- Persisting spring-music data using Postgres service, Part 2
- Scaling the spring-music webapp, Part 3
- Logging for the spring-music webapp, Part 4
- Monitoring the spring-music webapp, Part 5
In this particular article, we will look at application level monitoring of CF deployed applications using the New Relic Service Broker. The New Relic product enables real-time monitoring of applications.
New Relic Account
In order to send data to New Relic, we need to create a free trial account, no credit card is necessary.
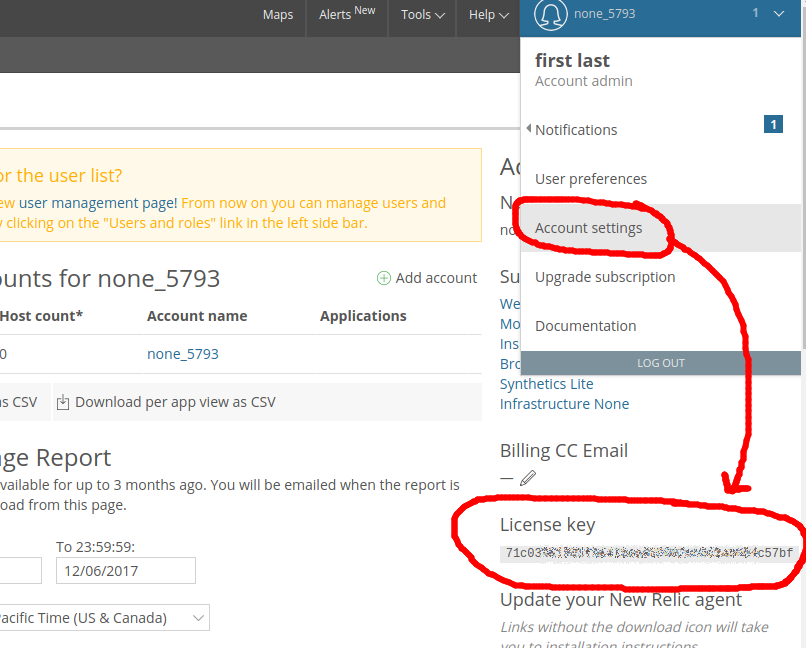
Clicking on the menu in the top right bar, and selecting “Account Settings” as shown below will show the license key string required by Cloud Foundry later.
New Relic Service Broker
Using the public Pivotal platform that we have been using throughout this series of articles, the New Relic service broker is already part of the marketplace. This can be verified using the “cf marketplace” command:
$ cf marketplace | grep -i relic
newrelic                   standard
Manage and monitor your apps
If it was not in the marketplace, you would need to download it and use the Ops Manager to import the New Relic Tile.
Assuming you have gone through the previous articles in this series and have a single instance of spring-music already pushed, the commands below will create a new relic service, bind it to spring-music, set the New Relic license key via an environment variable.
$ cf create-service newrelic standard newrelic-apm-service

$ cf bind-service spring-music newrelic-apm-service

$ cf set-env spring-music NEW_RELIC_LICENSE_KEY 71c039.....c57bf
You can see the effects of attaching the New Relic service by looking at the environment of the application, but these changes are still not pushed out to Pivotal servers until you restage the application.
$ cf set-env spring-music

$ cf restage spring-music
Now get the application URL where the data is being sent by parsing the logs like below and noting the URL being reported to.
$ cf logs spring-music --recent 2000 | grep "Reporting to"

2017-12-07T16:35:17.34-0500 [APP/PROC/WEB/0] OUT Dec 7, 2017 21:35:17 +0000 [18 32] com.newrelic INFO: Reporting to: https://rpm.newrelic.com/accounts/1221999/applications/103076999
Click around the application, modifying album information, deleting albums, etc. and then visit the URL captured above with your browser and you should see a screen similar to the one below.
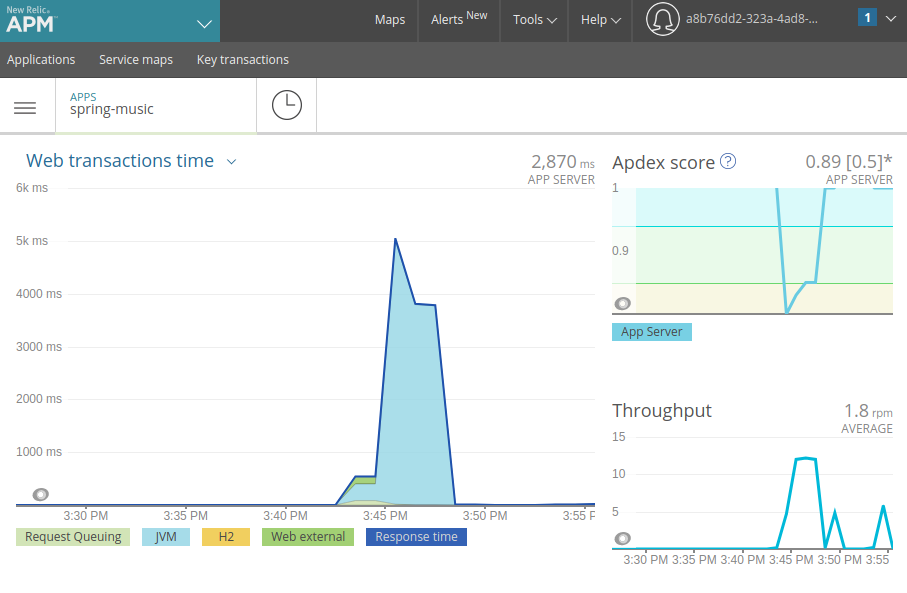
From this dashboard, you have all the power of New Relic at your fingertips with service entry points, transactions, JVM analytics, thread profiling, etc.
REFERENCES
http://docs.pivotal.io/partners/newrelic/index.html
https://network.pivotal.io/products/p-new-relic (download New Relic Service Broker)
https://blog.newrelic.com/2015/06/03/cloud-foundry-app-monitoring/
https://blog.newrelic.com/2013/10/14/use-new-relic-monitor-applications-cloud-foundry/
http://www.starkandwayne.com/blog/register-your-own-service-broker-with-any-cloud-foundry/ (service broker for local CF marketplace)
https://docs.pivotal.io/tiledev/1-12/tile-basics.html (tile basics)
https://docs.pivotal.io/tiledev/1-12/tile-structure.html (how tiles work)
https://docs.newrelic.com/docs/agents/java-agent/configuration/java-agent-config-file-template (java agent config, newrelic.yml)
https://docs.newrelic.com/docs/agents/java-agent/configuration/java-agent-configuration-config-file (env vars for agent)