![]() Java thread and heap dumps are valuable tools for troubleshooting local development, but they can also be used on remote CF containers running a JVM. In this article, we’ll go through various method of gathering this data from a Cloud Foundry container and then tools for analyzing this data.
Java thread and heap dumps are valuable tools for troubleshooting local development, but they can also be used on remote CF containers running a JVM. In this article, we’ll go through various method of gathering this data from a Cloud Foundry container and then tools for analyzing this data.
Now matter how uniform your environments, whether using Cloud Foundry stemcells/containers, configuration management tools, or Docker images, there are always real-world issues that show up only in certain environments (especially production!). There are unique corner cases that get exposed by end user experimentation, unexpected thread locking, generational memory issues, etc… and thread and heap dump analysis tools can assist.
In the following article I will issue commands as though I am working with the spring-music project, which is deployed as described in my article here.
Gathering a thread dump
Gathering via VisualVM
If you have JMX/RMI enabled for the container as described here, then from VisualVM’s “Threads” tab, you can press the “ThreadDump” button and full text listing will be created. You can copy-paste this text into a file named “<name>.tdump”.
This format has the downside that it is only parseable by VisualVM.
Gathering from inside the container
If your application is reachable via “cf ssh”, then you can take the thread dump from inside the container itself. You can use either jcmd or jstack, but we will use jcmd below:
$ cf ssh spring-music

vcap@...$ PID=`ps -ef | grep java | grep -v grep | awk {'print $2'}`
vcap@...$ rm /tmp/jcmd.tdump
vcap@...$ /home/vcap/app/.java-buildpack/open_jdk_jre/bin/jcmd $PID Thread.print > /tmp/jcmd.tdump
vcap@...$ exit
The thread dump file is local to the container, so we need to transfer it back to our host.
$ cf ssh spring-music -c "/bin/cat /tmp/jcmd.tdump" > jcmd.tdump
This thread dump file can be loaded by either VisualVM or IBM Thread Dump Analyzer. Another upside is that enabling JMX is not necessary.
Analyzing a thread dump
Analyzing via VisualVM
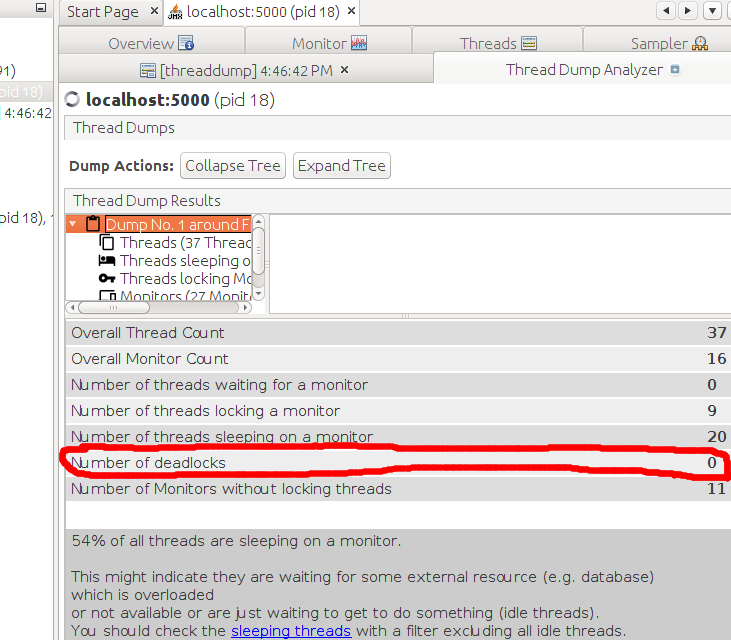
VisualVM can load and analyze a .tdump file produced by either itself or jcmd/jstack. See my article here for instructions on loading the TDA plugins (Thread Dump Analysis). After you do that, select File>Load, and filter by “Thread Dumps (*.tdump)”, select the local file and press OK.
This will give you a summary and categorization of the threads as shown below.
Analyzing via IBM Thread Dump and Analysis tool
The IBM Thread Dump and Analysis tool can be downloaded here, and can load and analyze a .tdump file produced by jcmd/jstack as described earlier. It cannot load the text generated by VisualVM.
The tool is a single jar, and can be started like:
$ java -Xmx512m -jar jca457.jar
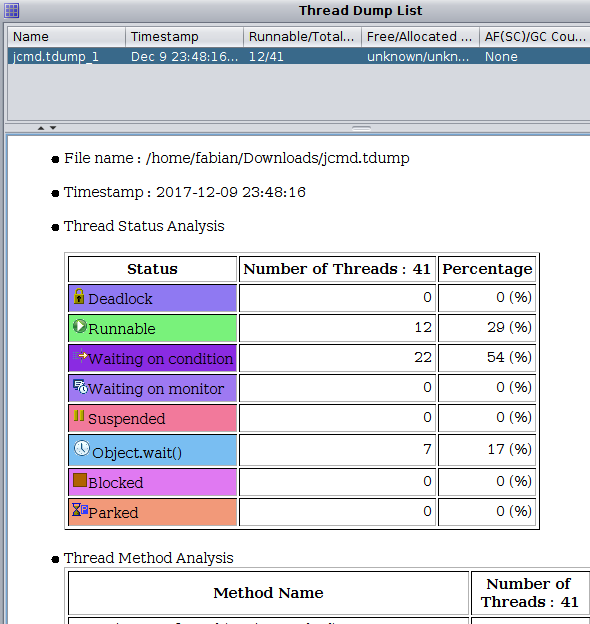
From the menu select File>Open Thread Dump and select the local “jcmd.tdump” file downloaded earlier, and you will be presented with a summarized thread dump list.
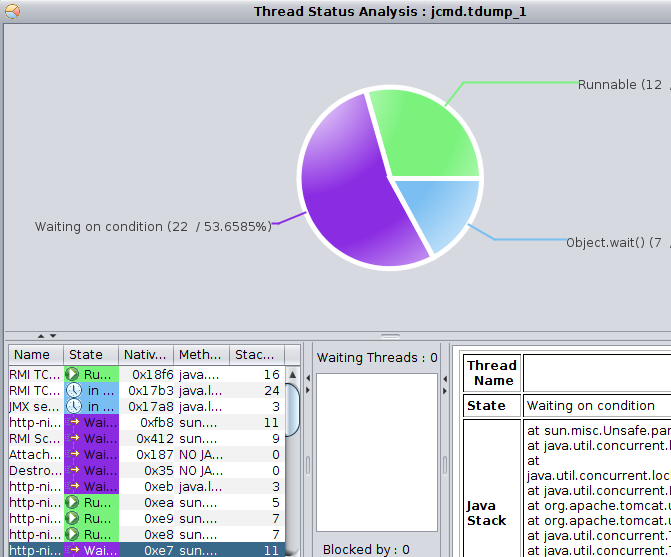
For further detail, select Analysis>Thread Status Analysis from the menu, and you can drill down into each thread, and exactly which thread is blocked/blocking.
Gathering a heap dump
Gathering via VisualVM
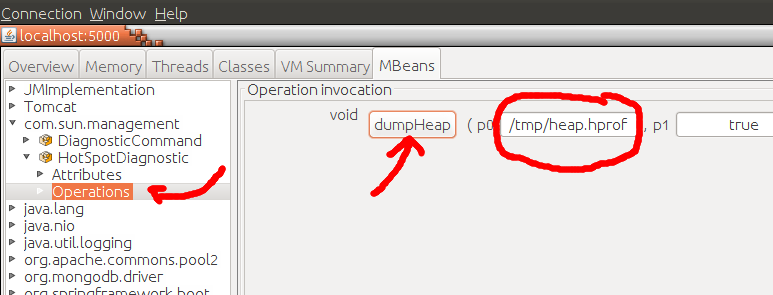
If you enabled JMX/RMI on the container as described in this article, then you can use jconsole or VisualVM with the MBean plugin to invoke a remote heap dump. I’ll show how this is done via jconsole since this tool is common to both Oracle and OpenJDK releases.
Using jconsole, select the “MBeans” tab and drill down to “com.sun.management” > HotSpotDiagnostic > Operations, and there will be an operation named “dumpHeap”. For the first String parameter, use the value “/tmp/jmx-heap-dump.hprof”, and then click the “dumpHeap” button.
This will create a file named “/tmp/jmx-heap-dump.hprof” in the remote container. To get this file back to your local host, use the “cf ssh” command like below. Do not stop the ssh tunnel which is tunneling JMX communication.
$ cf ssh spring-music -c "/bin/cat /tmp/jmx-heap-dump.hprof" > jmx-heap-dump.hprof
Gathering from inside the container
There are a couple of utilities provided by the Java Buildpack that can return a heap dump, both jmap and jcmd. Here is how you would use each:
$ cf ssh spring-music

vcap@...$ rm /tmp/jmap-heap.hprof
vcap@...$ rm /tmp/jcmd-heap.hprof

vcap@...$ PID=`ps -ef | grep java | grep -v grep | awk {'print $2'}`
Then one of the following commands:
vcap@...$ /home/vcap/app/.java-buildpack/open_jdk_jre/bin/jmap -dump:format=b,file=/tmp/jmap-heap.hprof $PID
vcap@...$/home/vcap/app/.java-buildpack/open_jdk_jre/bin/jcmd $PID GC.heap_dump /tmp/jcmd-heap.hprof
And since these files are created inside the container, we need to transfer them locally for analysis:
$ cf ssh spring-music -c "/bin/cat /tmp/jmap-heap.hprof" > jmap-heap.hprof

$ cf ssh spring-music -c "/bin/cat /tmp/jcmd-heap.hprof" > jcmd-heap.hprof
Analyzing a heap dump
Regardless of whether you gathered these heap dumps using JMX tools or inside the container, you can now analyze them using VisualVM.
From the main menu, File>Load, “Heap Dumps” and select the local “<name>.hprof” file.
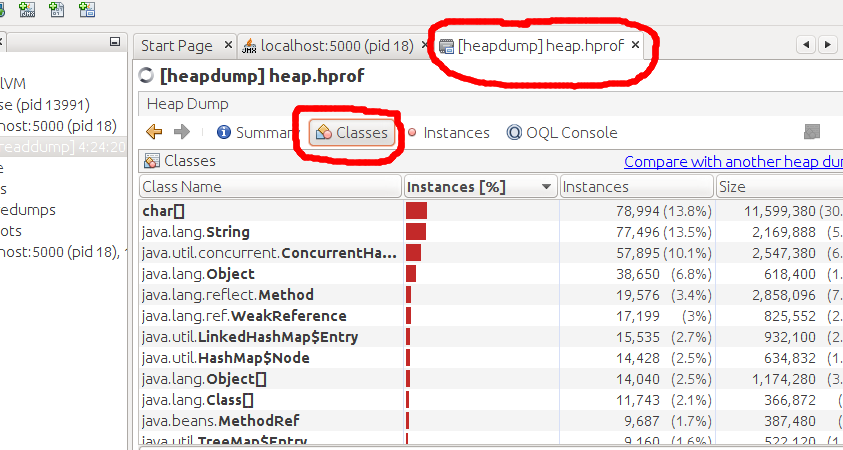
This will provide summaries, and as shown in the image above, the “Classes” tab will show which class instances and total size. You can even do comparisons with other heap captures (that you perhaps took at X minute intervals).
REFERENCES
https://www.ibm.com/developerworks/community/groups/service/html/communityview?communityUuid=2245aa39-fa5c-4475-b891-14c205f7333c (IBM thread dump analyzer home page)
http://cloud.rohitkelapure.com/2015/10/heapdumps-and-coredumps-on-cloud.html (jmap heapdump directly from container)
https://docs.cloudfoundry.org/devguide/deploy-apps/ssh-apps.html (how to scp into container)
http://happygiraffe.net/blog/2009/04/02/heap-dump-analysis/ (heap dump howto on jvisualvm)
https://stackoverflow.com/questions/856881/how-to-activate-jmx-on-my-jvm-for-access-with-jconsole (properties for both jmx and rmi necessary for docker and CF)
https://community.hortonworks.com/articles/72319/how-to-collect-threaddump-using-jcmd-and-analyse-i.html (options for jcmd, thread and heap dump)
https://gist.github.com/noahlz/865cc30e0fd93ad48369 (troubleshooting with jcmd)
https://helpx.adobe.com/experience-manager/kb/TakeThreadDump.html (thread dumps from jvm)
https://access.redhat.com/solutions/18178 (taking thread dumps)
https://dzone.com/articles/how-to-take-thread-dumps-7-options
http://fahdshariff.blogspot.com/2012/08/analysing-java-core-dump.html