![]() Enabling the use of real-time JVM monitoring tools like jconsole and VisualVM can be extremely beneficial when troubleshooting issues. These tools work by enabling a JMX/RMI communication channel to the JVM.
Enabling the use of real-time JVM monitoring tools like jconsole and VisualVM can be extremely beneficial when troubleshooting issues. These tools work by enabling a JMX/RMI communication channel to the JVM.
These are typically thought of as local development tools, but they can also be used on remote CF containers running Java. In this article, I’ll show you how to enable JMX/RMI to your remote Cloud Foundry container.
Prerequisites
There are a few requirements that have to be met in order to enable Java JMX/RMI with a Cloud Foundry application.
- Need to be using Diego containers (v1.6.x+)
- Need to have “cf ssh” access enabled to application
- Need Java buildpack v3.4+
If you have issues with “cf ssh”, go through the troubleshooting page here. One thing is to make sure your user has the SpaceDeveloper role, which can be verified using:
$ cf orgs
$ cf spaces
$ cf space-users <org> <space>
Enable JMX on CF app
If you are familiar with enabling JMX directly, then you know that typically you start the JVM with the following properties.
-Djava.rmi.server.hostname=<hostname>
-Dcom.sun.management.jmxremote
-Dcom.sun.management.jmxremote.port=<port>
-Dcom.sun.management.jmxremote.rmi.port=<port>
-Dcom.sun.management.jmxremote.authenticate=false
-Dcom.sun.management.jmxremote.ssl=false
This works well when dealing with a local environment where access to the port is available and firewall access is lax, but will be an issue for a public CF container.
Luckily the Java Buildpack gives us an easy way to enable JMX, and when paired with a secure tunnel to the container you expose a local port that can be used for JMX/RMI communication.
The following commands will enable JMX/RMI properties for the Java buildpack, restages the application, then creates a tunnel to the container and exposes it as a local port on 5000.
$ cf set-env spring-music JBP_CONFIG_DEBUG '{enabled: true}'

$ cf restage spring-music

$ cf ssh -N -T -L 5000:localhost:5000 spring-music
JMX with jconsole
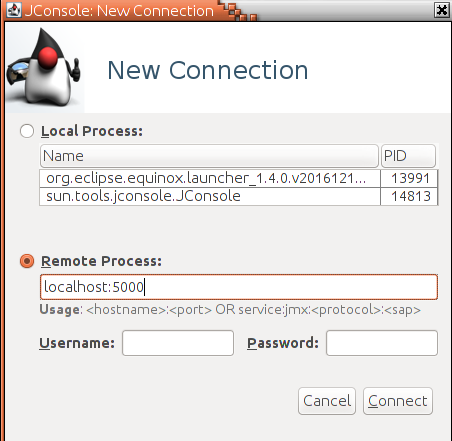
Let’s validate that we can make a connection to the remote container using one of the simplest JMX clients, jconsole.
JConsole is a tool that comes with both Oracle’s JDK as well as OpenJDK. It is not in active development anymore, but still does a good job at showing JVM memory/cpu info, threads, classes, and management beans. Start jconsole from the console:
$ jconsole
And specify that you want to connect to a remote host named “localhost:5000” as shown below.
The overview provides resource summaries.
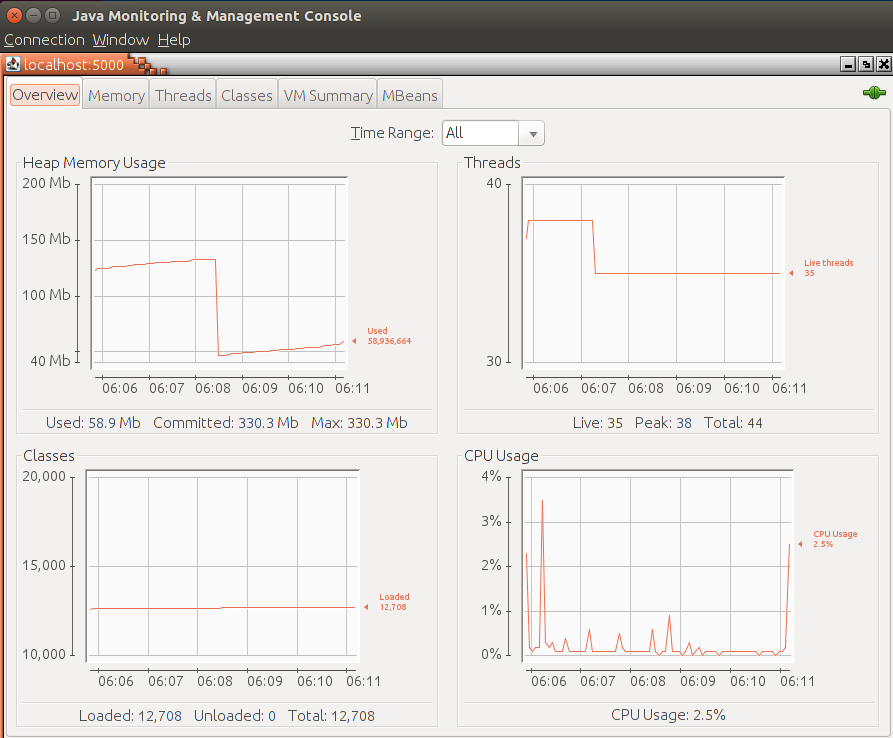
The “Threads” tab shows you a list of all the threads.
The “MBeans” tab allows you to navigate, view, and invoke operations on any of the JVM’s managed beans.
JMX using VisualVM
Now that we’ve proven basic JMX connectivity using jconsole, let’s switch over to a more advanced JMX client, VisualVM. It has more functionality, as well as plugins that extend the interface.
Install Oracle Java on host
VisualVM is only distributed with the Oracle JDK, so we need to install that on our local Ubuntu host first. There is a ppa that makes this easy enough.
$ sudo add-apt-repository ppa:webupd8team/java
$ sudo apt update; sudo apt install oracle-java8-installer

 (accept terms from text dialog)

$ sudo update-alternatives --config java

$ java -version
The last command should result in a banner listing Oracle’s 1.8 HotSpot JVM.
Start VisualVM
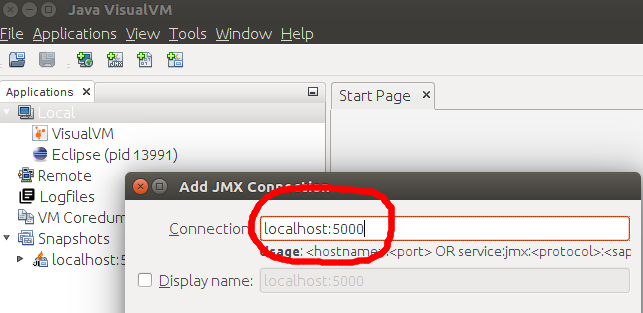
$ jvisualvm
Right click the “Local” node, and “Add JMX Connection”. Specify “localhost:5000” as the connection string and press “OK” as shown below.
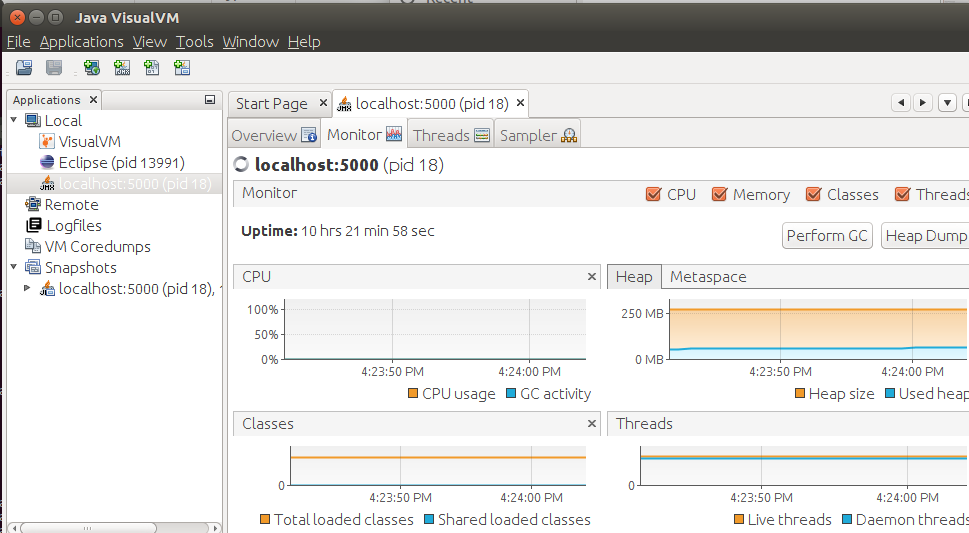
Double-click the new “localhost:5000” connection, and you will get an overview of the JVM properties. Select the “Monitor” tab and you will see graphed resource consumption.
Add VisualVM plugins
I would advise adding several plugins to VisualVM. Specifically, those that do thread analysis as well as exposing the management beans.
MBeans plugin
In the menu, select Tools>Plugins, then go to the “Available Plugins” tab. Select “VisualVM-MBeans”, and then “Install”. Follow the prompts and press “Finish”.
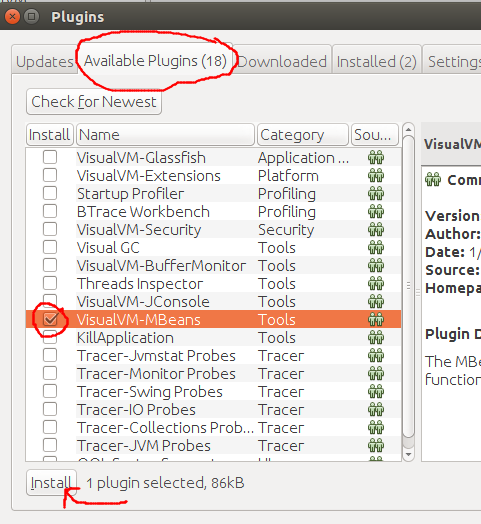
This adds an “MBeans” tab to your “localhost:5000” node, and similar to jconsole allows you to navigate, view, and invoke operations on any management beans.
Thread Analysis plugin
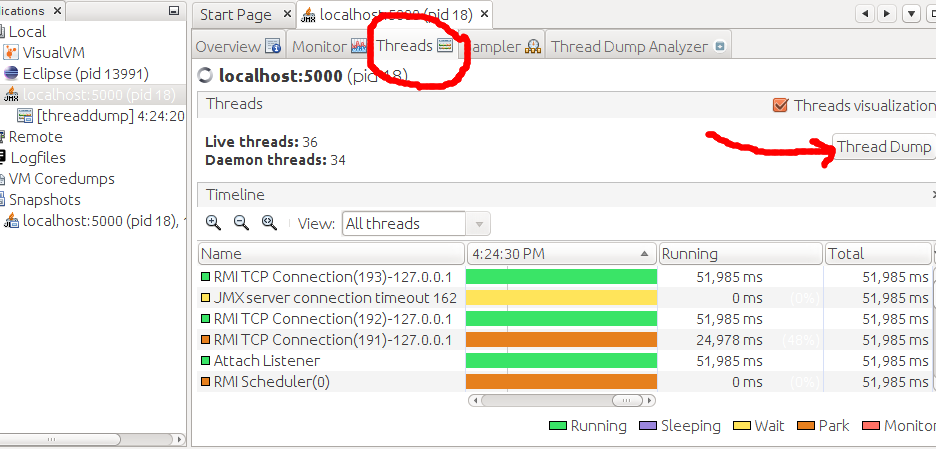
The standard VisualVM interface shows us all the threads being used, and even allows gives us a full thread dump (the format is not compatible with other thread analysis tools).
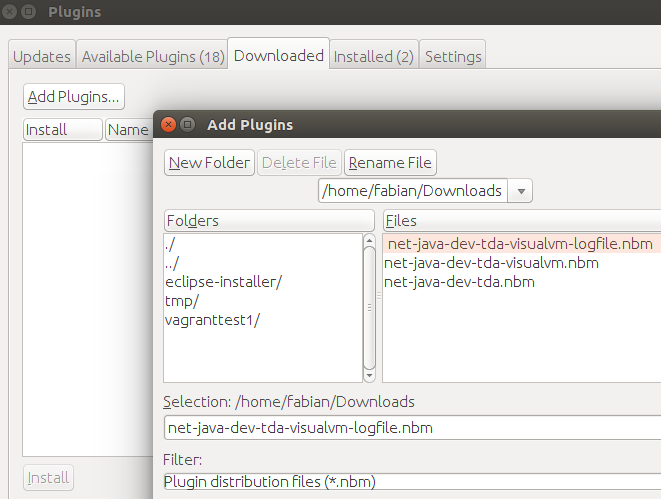
But if you want an analysis, use the TDA (Thread Dump Analysis) plugins. First, go to the TDA plugin release page, and download all three *.nbm files from the latest release.
Select Tools>Plugins from the main menu, and go to the “Downloaded” tab. Press “Add Plugins” and each *.nbm file you just downloaded. Start with “net-java-dev-tda.nbm”, then “net-java-dev-tda-visualvm.nbm”, then “net-java-dev-tda-visualvm-logfile.nbm”.
Click on the “Threads” tab, and you will see the current threads of the JVM. Click on the “Thread Dump” button, and you will get a thread dump listing in a new tab.
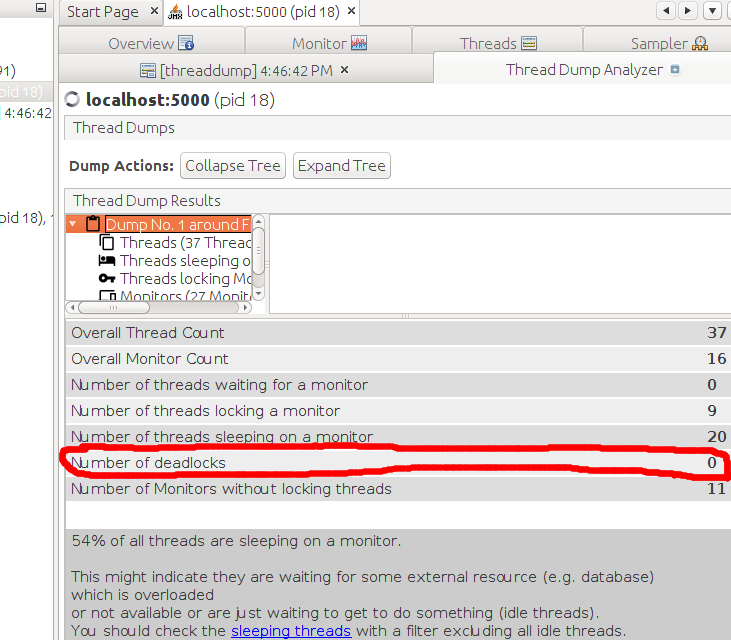
But you also get a “Thread Dump Analyzer” tab which provides a summary analysis as well as categorizations as shown below.
Summary
The JMX tools you are accustomed to in local development environments can also be leveraged in a remote Cloud Foundry container.
See my other article on gathering heap and thread dumps for Cloud Foundry containers, and using VisualVM and the IBM Thread Dump Analysis tool for analysis.
REFERENCES
https://visualvm.github.io/plugins.html (list of visualvm plugins)
https://github.com/irockel/tda (visualvm tda plugin, thread dump analyzer)
https://github.com/irockel/tda/releases (nbm releases of tda plugin – need to install all 3 .nbm from inside jvisualvm)
https://stackoverflow.com/questions/38905119/java-visualvm-mbeans-plugin (how to install plugin)
http://cloud.rohitkelapure.com/2015/10/heapdumps-and-coredumps-on-cloud.html (jmap heapdump directly from container)