![]() Most of the modern cloud platforms and utilities have us manipulate either JSON or YAML configuration files. And when you start dealing with real world scenarios with hundreds of lines of embedded data structures it is too difficult and error-prone to manually inspect indentation levels to determine the exact dotted or json path to an item.
Most of the modern cloud platforms and utilities have us manipulate either JSON or YAML configuration files. And when you start dealing with real world scenarios with hundreds of lines of embedded data structures it is too difficult and error-prone to manually inspect indentation levels to determine the exact dotted or json path to an item.
This is where dot notation can assist. The left console below shows a nested JSON data structure that we would need to manually backtrack to determine path, while the right hand side shows its equivalent dot notation.
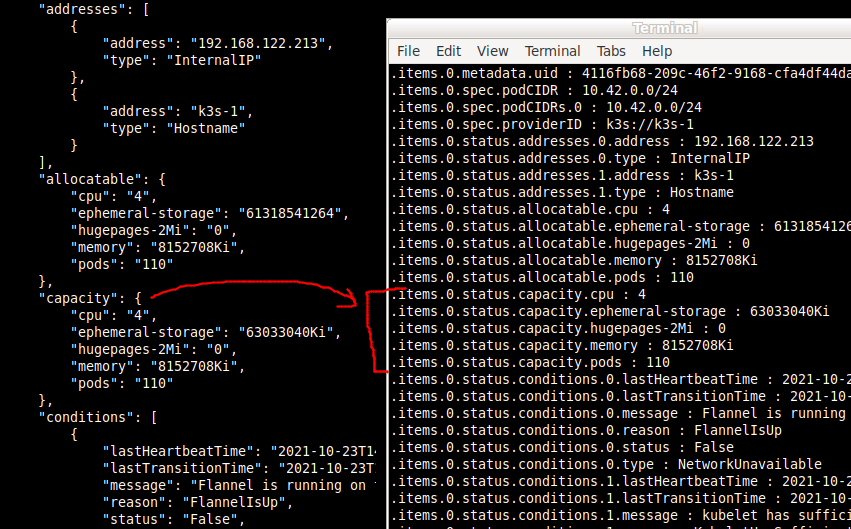
Yes, the left hand side makes it easier to see structure, but the right hand side gives us the full dot notation or JSON path we need to either filter, retrieve, or patch the structure.
Here is how you would place json-to-dot.py in your PATH.
wget https://raw.githubusercontent.com/fabianlee/blogcode/master/python/json-to-dot.py
chmod +x json-to-dot.py
sudo cp json-to-dot.py /usr/local/bin/.
Now let’s go through a couple of real examples with kubectl and helm.
Kubectl service clusterIP example
Let’s start with an easy example where you want to pull the clusterIP from a service.
# 55 lines of json returned that must be eyeballed for path
$ kubectl get services mailhog -n email -o=json

# json-to-dot can isolate this to 2 candidate paths
$ kubectl get services mailhog -n email -o=json | json-to-dot.py | grep clusterIP

.spec.clusterIP : 10.43.129.9
.spec.clusterIPs.0 : 10.43.129.9

# use fully dotted path to extract just the value
kubectl get services mailhog -n email -o=jsonpath="{.spec.clusterIP}"
10.43.129.9
In this very simple case, we only have 55 lines of json to manually scan, and so determining that the full path to the value is “.spec.clusterIP” is not very difficult.
But obviously in real-world scenarios, our json output is not typically so brief or flat, and that is where having the fully dotted notation is advantageous.
Kubectl docker image example
Let’s say you want to pull the docker image location for all the pods in your default namespace.
# there are only 3 pods in the default namespace, should be easy?
$ kubectl get pods
NAME READY STATUS RESTARTS AGE
tiny-tools-ds-72h4h 1/1 Running 0 6h9m
golang-hello-world-web-5c545766bf-89s2k 1/1 Running 0 4h32m
golang-hello-world-web2-6cd5bcb745-4r9fg 1/1 Running 0 4h30m

# pulls back data in json format (781 lines of output!)
$ kubectl get pods -o=json
When you pull back the JSON for the 3 pods, you get hundreds of lines of json. Maybe you pipe it to a file, then use vim or grep and search for words like ‘docker’ or ‘image’. Maybe you have enabled folding in your vim editor and reverse-traverse the nested location, or maybe you bring it back to your local desktop IDE which has a yaml plugin that can help.
OR you could expand out this JSON into dot notation and use grep to help filter down the possible entries.
$ kubectl get pods -o=json | json-to-dot.py | grep "image "

From this screenshot, you can see that the docker images can be found at: .items[].spec.containers[].image, which we can then feed to the “jsonpath” flag of kubectl to retrieve the image locations.
# shows each pod's image
$ kubectl get pods -o=jsonpath='{.items[*].spec.containers[0].image}'
Helm example
Helm charts wrap up complex Kubernetes application stacks, and expose a set of variables that we can use to change the behavior per our environment. For example, here is the Helm chart for the Prometheus monitoring stack.
# install chart
helm repo add prometheus-community https://prometheus-community.github.io/helm-charts
helm repo update

# show list of all chart variables
# 2688 lines of yaml output
helm show values prometheus-community/kube-prometheus-stack
Helm outputs the list of variables that can be modified for this chart as 2688 lines of YAML output, which is difficult to manually grok. Additionally, if you plan on using the “set” flag there is an impedance mismatch because the output is YAML while the “set” flag takes a dotted notation.
A much easier way is to convert this YAML to JSON (yq), and then show the dot notation. Below we do just that, only showing the grafana related values.
helm show values prometheus-community/kube-prometheus-stack | \
yq eval - -o=json -P | \
json-to-dot.py | grep grafana

Now if we want to install with Grafana ingress enabled, we can see the dot notation is “grafana.ingress.enabled”, and use the set flag like below.
helm install prometheus prometheus-community/kube-prometheus-stack --set grafana.ingress.enabled=true
REFERENCES
Code for json-to-dot.py comes from techtldr.com
stackoverflow with multiple solutions for dot notation
Alternate python for dot notation, does sorting of keys but does not show values