![]() The Windows Zabbix Agent provides a native interface to the Windows Performance Counters. and Event Log. This means that with minimal overhead, and no additional shells out to Powerscript or the command line, you can collect any of the metrics available from PerfMon or Event Viewer.
The Windows Zabbix Agent provides a native interface to the Windows Performance Counters. and Event Log. This means that with minimal overhead, and no additional shells out to Powerscript or the command line, you can collect any of the metrics available from PerfMon or Event Viewer.
Windows Event Log
To monitor the Windows Event log, use the eventlog[] item keys. This takes the syntax:
eventlog[name,<regexp>,<severity>,<source>,<eventid>,<maxlines>,<mode>]
I would always recommend using Event Viewer on the host to determine which event log names and exact codes you want to pull before trying to craft the query parameters.
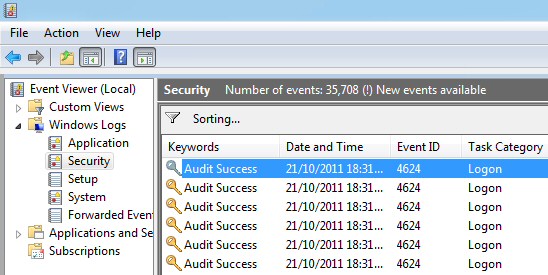
As an example, let’s capture all the interactive login events happening on the host which are logged in the “Security” event log. On a host that has a Zabbix Agent on Windows, create an item with the type “Zabbix agent (active)”:
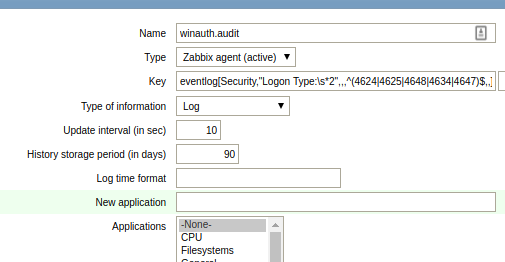
Name: winauth.audit
Type: Zabbix agent (active)
Key: eventlog[Security,"Logon Type:\s*2",,,^(4624|4625|4648|4634|4647)$,,]
Type of information: Log
Update interval: 30
These 46xx codes are documented by Microsoft, and the logon type=2 signifies interactive logon.
Now going to Monitoring > Latest data after an interactive login should show you the event log entry within 30 seconds. This will show both successful as well as login failures.
Windows Performance Counters
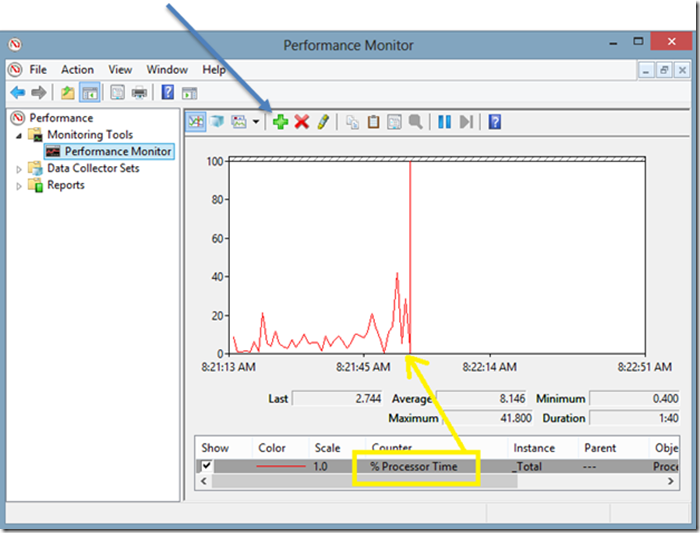
The PerfMon tool comes standard on Windows hosts and can be used to capture and display live metrics as they are collected by the system.
Collecting these same metrics using the Zabbix agent can be done using the perf_counter key. The syntax is:
perf_counter[counter,<interval>]
The easiest way to discover the full path to these counters is to use PerfMon to first find and examine the keys. But you can also list all the full paths from the command line using “typeperf -qx”.
In this example, I’m going to monitor the keys for:
- Microsoft IIS total GET and PUSH operations
- Microsoft FTP Server total files sent and received
- Microsoft SMTP server total mail received, delivered, and pending
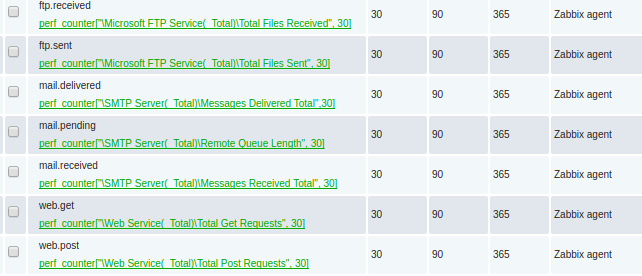
Which are represented as the Zabbix key values below:
perf_counter["\Web Service(_Total)\Total Get Requests",30]
perf_counter["\Web Service(_Total)\Total Post Requests",30]

perf_counter["\Microsoft FTP Service(_Total)\Total Files Sent",30]
perf_counter["\Microsoft FTP Service(_Total)\Total Files Received",30]

perf_counter["\SMTP Server(_Total)\Remote Queue Length",30]
perf_counter["\SMTP Server(_Total)\Messages Received Total",30]
perf_counter["\SMTP Server(_Total)\Messages Delivered Total",30]
REFERENCES
https://zabbix.org/wiki/Get_Zabbix
https://msdn.microsoft.com/en-us/library/ms804624.aspx (Web Service Object)
https://www.zabbix.com/documentation/3.0/manual/appendix/config/zabbix_agentd_win (agent conf, PerfCounter is sythesized avg value of sys perf meaning it needs float)
https://www.zabbix.com/documentation/2.4/manual/appendix/config/zabbix_agentd_win?s[]=perfcounter
https://www.zabbix.com/documentation/3.2/manual/config/items/itemtypes/zabbix_agent/win_keys (special item keys for Zabbix Windows agents)
https://docs.microsoft.com/en-us/previous-versions/windows/it-pro/windows-server-2008-R2-and-2008/dd941621(v%3dws.10) (4634 4646 audit logoff)
https://docs.microsoft.com/en-us/previous-versions/windows/it-pro/windows-server-2008-R2-and-2008/dd941635(v%3dws.10) (4624,4625,4648 audit logon)
https://social.microsoft.com/Forums/en-US/712230b0-2d99-4cda-a374-1211117bf2a8/create-a-custom-security-log-event?forum=Offtopic (cannot write to security log, permissions)
NOTES
$ svn co svn://svn.zabbix.com/branches/2.4 (checkout source code)
eventcreate /l System /t INFORMATION /id 99 /d “just a test” (ids < 1000)
Write–EventLog –LogName Application –EntryType Error –Source MSSQLSERVER –EventId 1479 –Message “Test error event – ignore” (cannot write to SECURITY due to permissions)
Monitoring postfix queue on linux:
typeperf -qx
typeperf -qx “SMTP Server”
typeperf -qx “Web Service”
typeperf -qx “Microsoft FTP Server” (“FTP Service” on older IIS6)